Demos
Demos


Highlights
- A higher variation observed for ambulatory healthcare services access (indicator) among countries where the cost (indicator) of ambulatory health care services is smaller than OECD average cost
- A small variation observed for perceived ambulatory health care services quality (indicator) among 10 OECD countries
- Further exploration, focused on 5 OECD and involving new indicators, can be considered
1. Introduction
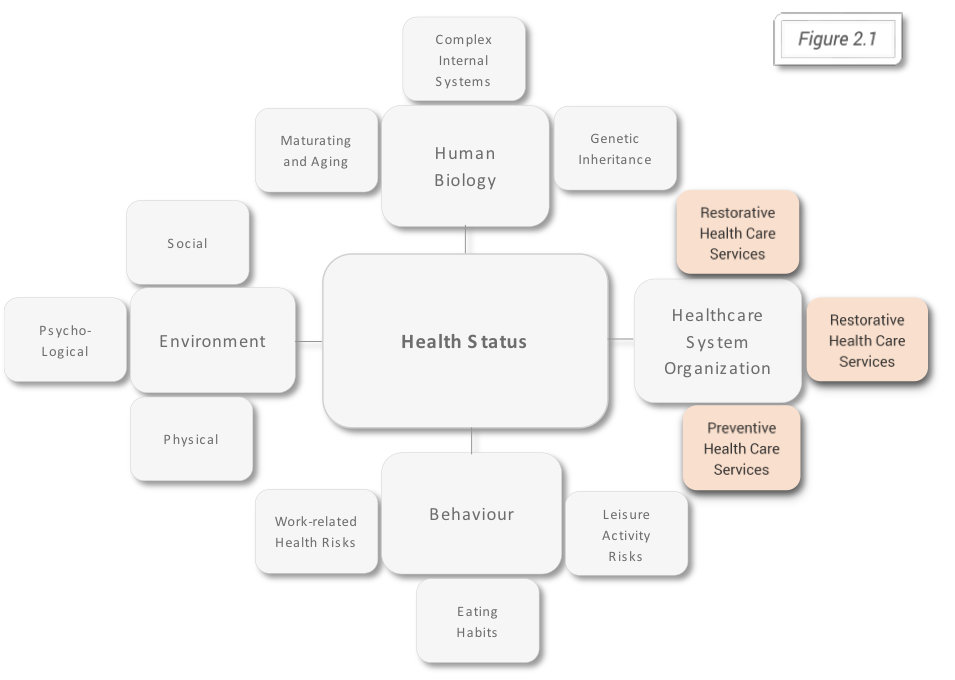
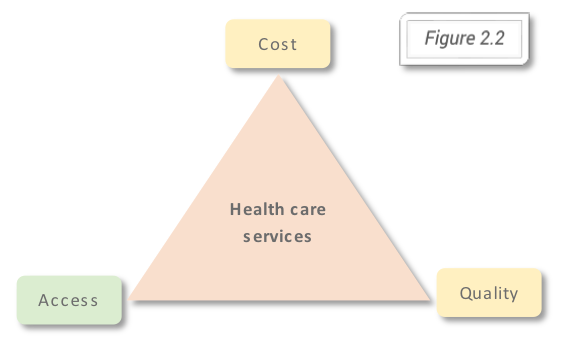
One of the main four health determinants (Alan Dever model, figure 2.1) is represented by the healthcare system organization, based on the three types of health care services: preventive, curative and restorative. The forces on which depends the output at the individual level and outcome at the population level are according to the Iron Triangle of Healthcare, first introduced by William Kissick (figure 2.2), cost, access, and quality.
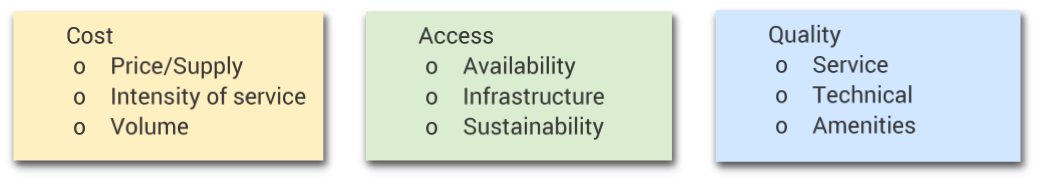
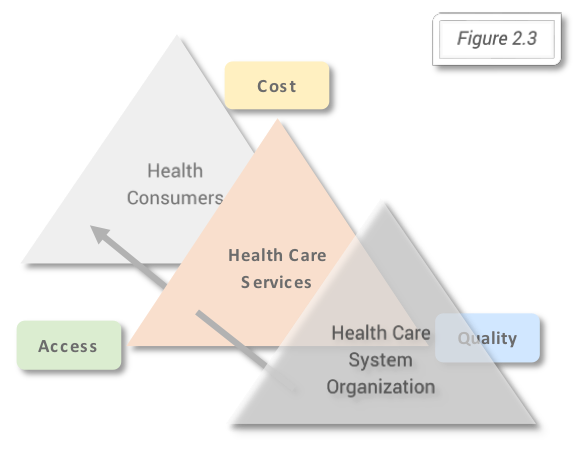
According to this model the strategic decisions at organizational level (influencing the output) and at governmental level (influencing the outcome) will influence the balance or the choice for one of the three forces or dimensions of the health care services and in this way results for the health (services) consumers (figure 2.3). Comparing the outcomes for different healthcare systems and observing the three dimensions: cost, access, and quality based on the Iron Triangle of Health Care is the purpose of the bellow described methods used. Joel Shalowitz model describes the elements on which directly and non-directly the three dimensions depend. In the boxes below are listed the elements Joel Shalowitz model, directly linked to the three dimensions of the Iron Triangle of Healthcare.
2. Methods
The analysis will be made using the health indicators data available for the countries members of The Organisation for Economic Co-operation and Development (OECD), provided by OECD. The quality of data provided by OECD depends on the quality of the national statistics and at the same time on the internal processes which are based OECD Statistics Directorate Quality Framework and Guidelines for OECD Statistical Activities, from 2011.
About OECD and OECD member countries
OECD was officially born in 1961 after the OECD Convention was signed by the 18th countries members of Organisation for European Economic Cooperation (OEEC), the United States and Canada. Since then another 15 countries joined the organization and so, starting 2010, OECD has 35 member countries. According to OECD website, the organization includes “many of the world’s most advanced countries but also emerging countries like Mexico, Chile and Turkey” and from different regions of the world, North and South America, Europe, and Asia-Pacific. Below are listed, in alphabetical order, the countries members of OECD, based on the continent they belong to:
- Australia/Oceania: Australia, New Zealand
- Asia: Israel, Japan, Korea, Turkey
- Europe: Austria, Belgium, Czech Republic, Denmark, Estonia, Finland, France, Germany, Greece, Hungary, Iceland, Ireland, Italy, Latvia, Luxembourg, Netherlands, Norway, Poland, Portugal, Slovak Republic, Slovenia, Spain, Sweden, Switzerland, United Kingdom
- North America: Canada, Mexico, United States
- South America: Chile
Statistical approach
The data used in this analysis can be found along with all available statistics provided by OECD and the metadata (information about data), in John Snow Labs` Healthcare Datasets Library. The analysis will be based on the averages of the values covering the period starting with the year 2000, regardless of the availability of data for every year used to calculate the values and on the OECD average for the same period. To standardize and, in this way, compare the countries averages, ratios for each country will be calculated according to the formula:
Country Indicator Ratio = Observed Indicator Value average/Expected Indicator Value average = Country Indicator Value average / OECD Level Indicator Value average
OECD Health Indicators Used
Before calculating the averages, indicators for the three dimensions were selected using the available data provided by OECD. Because this article is not intended to cover all measurement options for the indicators on which analysis will be based, the most representative indicators for each dimension were used. A complete list of indicators provided by OECD and included in John Snow Library, which can be used in an extended analysis will be provided at the end of this part of the article. At the same time, it is important to mention that proxy indicators will be considered an option especially for access to health care where there isn’t available a synthetic measure like for costs or quality.
Three key indicators were selected, one for each of the dimensions.
For the cost, the current expenditure on health per capita, at current prices standardized using purchasing power parities method (PPPs), for providers of ambulatory health care, has been considered the best option which will fit with the two others key indicators. According to the definition provided by OECD, PPPs are the “rates of currency conversion that equalize the purchasing power of different currencies by eliminating the differences in price levels between countries”. The indicator was chosen as it represents a synthetic measure of health care costs associated to health services provided in ambulatory care settings and because it can be easily used in a comparison, giving the standardization using PPPs method. In comparison with the share of GDP measure for health financing, it uses an easier to comprehend unit of measurement (currency).
The access indicator chosen is the number of consultations by doctors per capita which includes the following: consultations/visits both to generalist and specialist medical practitioners, consultations/visits at the physician’s office, consultations/visits in the patient’s home, consultations/visits in outpatient departments in hospital and ambulatory health care centres. According to the information provided by OECD the consultations do not include patient-doctor interaction through telephone and email contacts, the visits for prescriptions, bed laboratory tests, visits to perform prescribed and scheduled treatment procedures (e.g. injections, physiotherapy etc), visits to dentists, visits to nurses, consultations during an inpatient stay or a day care treatment. For 32 OECD member countries data for the mentioned access proxy indicator and for the chosen cost indicator as well was found available.
For the last of the three dimensions of the Iron Triangle of Health Care, quality was used a qualitative indicator, giving its advantage of targeting the satisfaction of the healthcare consumer. The age and gender adjusted rate of survey respondents who always or often received enough time for consultation, used in the analysis together with the number of consultations per capita, has the advantage to give a better understanding about the value related to the number of consultation. A relatively good level of access, but with a time per consultation that is not satisfactory for the health consumers, in real terms can be interpreted as not being so good because the access issue is not entirely solved. The quality indicators based on patient experience, for which data were collected through population survey, were evaluated by the Norwegian Knowledge Centre for the Health Services regarding the possibility of cross-national comparability. Since such data is available only for a limited number of 10 OECD member countries: Australia, Belgium, Czech Republic, Estonia, Israel, Japan, Korea, Luxembourg, New Zealand, Portugal the complete analysis, based on the three dimensions, will be limited only to these countries.
All countries for which data for both, cost and access, are available were included in the second analysis.
3. Results
A visual analysis of cost, access, and quality among (the) 10 OECD member countries
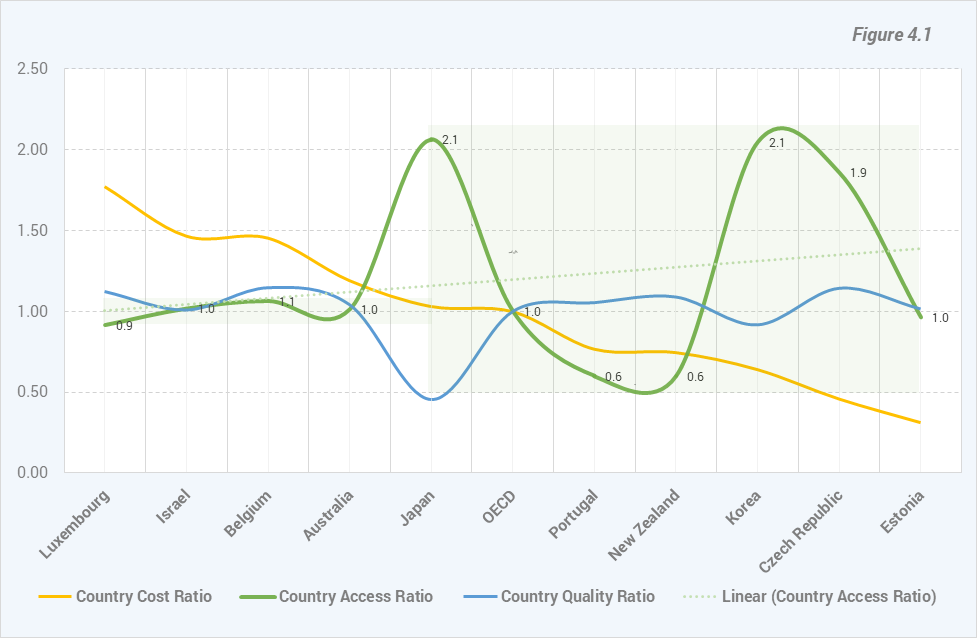
Analysing the three dimensions for the 10 OECD member countries we can observe (Figure 4.1), ordering the countries from the country with the grates cost ratio (Luxemburg) to the one with lowest ratio (Estonia) there is an increased variation among the countries access ratios values positioned on the right side of the chart. Japan access ratio value is the first one that can be visually included in this group of values. At the same time based on the Linear trendline, the best fit straight line for the access ratios values indicates an opposite trend of Access Ratios compared to Cost Ratios trend. The variation on both sides is represented by green boxes.
Regarding the quality cost ratio series of values can be observed (Figure 4.1) that for almost all countries the variation is relatively small, except for Japan quality ratio value which is less than half of the OECD value.iA visual analysis of cost and access among (the) 32 OECD member countries
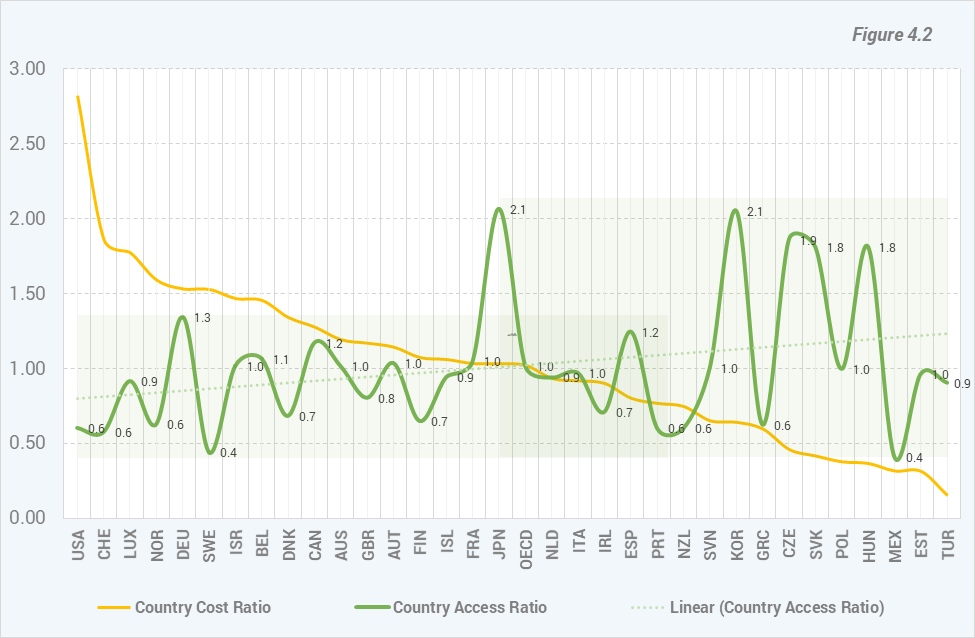
Letting out of the analysis the quality ratio values and extending the analysis on the 33 OECD member countries the aspects observed on the 10 countries can be observed, although not so prominent, among a bigger number of country ratio values. The increasing trend of access ratio values can be observed along with the variation differences between the two sides. At the same time an intermediate area that contains Japan ratio value and values among which the variation is more comparable with the values from the left side of the chart.
Because the variation, as can be observed in this last figure, is given by the values greater than the OECD ratio, a closer look is needed, to the countries to which the values belong. There are 5 countries with ratio values
significantly greater than OECD ratio value: Japan, Korea, Czech Republic, The Slovak Republic and Hungary. Japan and Korea are geographical neighbors, as well as the Czech Republic, the Slovak Republic and Hungary. The Czech Republic and the Slovak Republic were united before the Iron Curtain fall in a single country (Czechoslovakia).
4. Conclusions
The reasons behind higher variation observed among countries with a cost ratio level similar or higher than OECD level can be further explored using new indicators new statistical methods. A lower cost for ambulatory health care services associated with a higher access and utilization of these type of services can be analyzed regarding the physical access (distance), the number of doctors and ambulatory healthcare facilities and regarding the type of health insurances. As can be seen from Figure 4.1 the Japan and Korea satisfaction level of health consumers when asked if always or often received enough time for consultation is lower than the OECD average level. On the other side, the same level of satisfaction of the health consumers measured in the Czech Republic is higher than OECD average level and have a similar level with the other countries with a better satisfaction level.
This can be another reason to consider that is something here which deserves a better understanding through further exploration.