Clinical measures: standardized calculations on OMOP data
Patient Journey Intelligence's Clinical Measures module is the single authoritative environment for defining, validating, and computing clinical calculations on your OMOP CDM data - from BMI and eGFR to CHADS₂-VASc and HbA1c control status. Define a measure once with peer-reviewed evidence and SQL logic, then apply it reproducibly across cohorts, quality programs, registries, and research studies.
Clinical Measures Calculation
This video demonstrates the interface visually without audio narration.
Why clinical measure inconsistency is a bigger problem than it looks
Most healthcare analytics teams carry a hidden liability: every project reinvents the same calculations. One data scientist defines "poorly controlled diabetes" as HbA1c >9%, another uses 8.5%, and the quality team's EHR report uses a third threshold. These aren't edge cases - they're the norm. And when results conflict, teams spend days reconciling definitions instead of acting on findings.
The consequences go beyond wasted time. Inconsistent measure definitions mean research findings from one team can't be validated by another. Quality reports submitted to CMS or HEDIS programs may not match internal analytics. When an analyst leaves, the formula rationale leaves with them. And in regulated environments, the inability to trace a patient-level result back to a documented, evidence-based definition is an audit risk.
The Clinical Measures module solves this by making every calculation a first-class, documented, versioned artifact - defined once, validated against known inputs, linked to clinical evidence, and available to every team on the platform.
The difference in practice:
Without standardized measures:
- Data scientist writes SQL defining "poorly controlled" as HbA1c >9%
- Quality team uses Excel with threshold of 8.5%
- Clinical team references a different calculation in EHR reports
- Results conflict. Teams spend hours reconciling. Patient outreach delayed.
With Clinical Measures module:
- "Diabetes Control Status" defined once with HbA1c >9%, per ADA guidelines
- Clinical documentation explains the rationale
- SQL logic is validated with test cases
- Every team queries the same calculation - consistent, reproducible, auditable
This principle holds across hundreds of calculations, from simple vital sign conversions to complex risk scores that pull from a dozen OMOP domains.
Module overview
The Clinical Measures module has two integrated components. The Clinical Measures Library is where measures are defined, documented, and stored - a searchable catalog with formulas, evidence references, normal ranges, and validation logic for each calculation. The Patient Metrics interface is where those measures are applied - a cohort-scoped workspace for computing selected calculations across patient populations and reviewing results.
Clinical Measures Library
Searchable catalog of all available measures with clinical documentation, formulas, and validation logic
Patient Metrics
Cohort-based interface for computing selected measures across patient populations and reviewing results
At-a-glance dashboard metrics
Four summary indicators give you instant visibility into the health of your measure library:
Total Measures
Complete inventory of defined clinical calculations available in the system
Active Measures
Measures currently enabled for computation and analysis
Failed Measures
Measures with validation or execution failures requiring attention
Outstanding Measures
Defined measures awaiting evaluation or execution
These indicators let administrators and analysts quickly assess measure readiness, catch configuration issues before they affect downstream analytics, and monitor pipeline health across quality programs.
Backend calculation pipeline
Clinical calculators run automatically as the final stage of data ingestion when Step 7 is enabled. You don't trigger them manually - the pipeline runs as part of the standard ingestion cycle, ensuring patient-level results stay current as new data arrives.
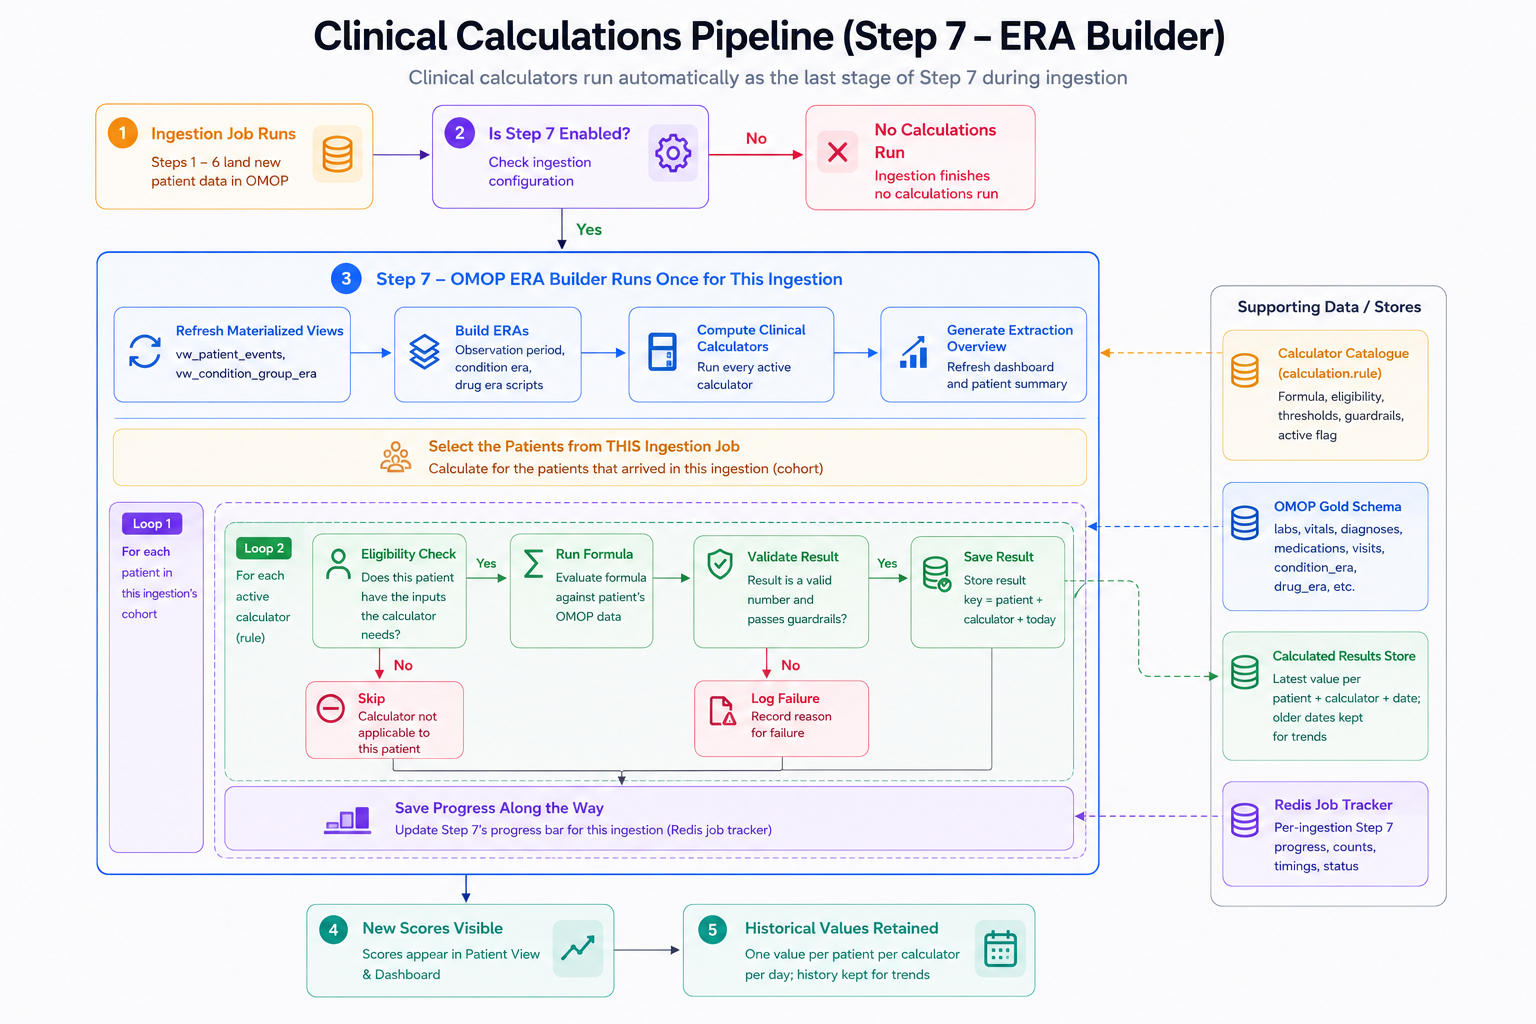
Automated clinical calculation pipeline in Patient Journey Intelligence.
The pipeline refreshes materialized views, builds ERA inputs, computes all active calculators for the ingestion cohort, validates results, and stores patient-level values - retaining historical readings so you can track clinical trajectories over time. Dashboard and patient views are updated automatically on completion.
Clinical Measures Library
The library presents every available measure in a card-based interface designed for quick discovery. Each card shows the measure name, clinical category, description, normal range, and current status.
Example measure card:
Body Mass Index (BMI)
- Category: Endocrinology, Nutrition
- Description: Weight-to-height ratio for assessing obesity risk
- Normal Range: 18.5 - 24.9 kg/m²
- Status: Active
Click the card to view full documentation, formula details, and patient-level results.
Click any card to open the full detail view - clinical documentation, formula, evidence references, threshold definitions, and a cohort-scoped results table. This is where you see the measure in action against your actual patient data.
Search and filter
Locate relevant measures efficiently using multiple strategies:
- Keyword search: Find measures by name, description, or clinical terms (e.g., "kidney function" returns eGFR, creatinine clearance, BUN/Cr ratio)
- Category filters: Browse by clinical domain (Cardiology, Pulmonology, Endocrinology, etc.)
- Sort options: Order by name, clinical area, creation date, or usage frequency
During cohort design or model development, this discovery interface saves the time that would otherwise go into searching shared drives for the right formula or asking a colleague which SQL query to use.
Creating a new clinical measure
Every new measure follows a five-step workflow that enforces clinical validity, technical correctness, and full documentation before the calculation enters the library. Click New Clinical Measure to begin.
Step 1: Basic information
Name the measure and describe its clinical purpose:
Example:
- Measure Name: Body Mass Index (BMI)
- Data Type: Continuous numeric value
- Clinical Description: Calculates body mass index from weight and height measurements. Used to assess weight status and obesity-related health risks.
Good naming matters here. Consistent conventions - including units in the name, e.g., "BMI (kg/m²)" or "HbA1c (%)" - make measures discoverable and unambiguous across teams.
Step 2: Usage documentation
Document exactly when to use this measure, how to interpret results, and why it matters clinically. This is the context that survives staff turnover and keeps every team working from the same understanding:
When to Use:
- Screening for overweight and obesity
- Assessing cardiovascular disease risk factors
- Monitoring weight management programs
- Evaluating metabolic syndrome criteria
How to Use:
- Requires recent weight and height measurements from the same date
- Calculated automatically when both measurements are available
- Track changes over time to monitor weight trends
Why It Matters:
- Identifies patients at increased risk for obesity-related conditions
- Guides interventions for weight management and lifestyle modification
- Required for metabolic syndrome diagnosis and bariatric surgery evaluation
- Supports population health initiatives targeting obesity prevention
Step 3: Ranges and thresholds
Define interpretation boundaries and clinical decision points so results carry meaning, not just numbers:
BMI Reference Ranges (Adults):
- Underweight: <18.5 kg/m²
- Normal weight: 18.5-24.9 kg/m²
- Overweight: 25.0-29.9 kg/m²
- Obesity (Class I): 30.0-34.9 kg/m²
- Obesity (Class II): 35.0-39.9 kg/m²
- Obesity (Class III): ≥40 kg/m²
Clinical Alerts:
- BMI <18.5: Flag for malnutrition screening and nutritional assessment
- BMI ≥30: Alert for obesity counseling and comorbidity screening
- BMI ≥40: Consider bariatric surgery evaluation
These thresholds populate the results table and patient views automatically, so anyone reading a result sees both the value and its clinical interpretation without additional lookup.
Step 4: Evidence and references
Link to the guidelines, peer-reviewed papers, and institutional protocols that justify your thresholds. This is what makes the measure defensible in audits and reproducible across studies:
Supporting Evidence:
- WHO Expert Consultation. Appropriate body-mass index for Asian populations. Lancet. 2004;363(9403):157-163
- CDC: About Adult BMI (2022)
- Jensen MD et al. 2013 AHA/ACC/TOS Guideline for the Management of Overweight and Obesity in Adults
- Institutional Protocol: Obesity Screening and Management, v2.1 (2024)
A measure without an evidence link is a formula waiting to drift. Linking to the authoritative source makes future updates straightforward: when ADA revises the HbA1c control threshold, you update the measure once, and the change propagates everywhere it's used.
Step 5: Technical definition
Provide the SQL implementation that runs against your OMOP data, along with test cases and input validation rules:
Formula:
BMI = weight (kg) / height (m)²
SQL Implementation:
WITH weights AS (
    SELECT
        m.person_id,
        m.measurement_date::date AS mdate,
        m.value_as_number AS weight_kg,
        m.unit_concept_id,
        ROW_NUMBER() OVER (
            PARTITION BY m.person_id, m.measurement_date::date
            ORDER BY COALESCE(m.measurement_datetime, m.measurement_date) DESC,
                     m.measurement_id DESC
        ) AS rn
    FROM tpj.measurement m
    WHERE m.measurement_concept_id = 3013762 -- Body weight
      AND m.value_as_number IS NOT NULL
      AND m.value_as_number > 0
),
heights AS (
    SELECT
        m.person_id,
        m.measurement_date::date AS mdate,
        m.value_as_number AS height_cm,
        m.unit_concept_id,
        ROW_NUMBER() OVER (
            PARTITION BY m.person_id, m.measurement_date::date
            ORDER BY COALESCE(m.measurement_datetime, m.measurement_date) DESC,
                     m.measurement_id DESC
        ) AS rn
    FROM tpj.measurement m
    WHERE m.measurement_concept_id = 3036277 -- Body height
      AND m.value_as_number IS NOT NULL
      AND m.value_as_number > 0
)
SELECT
    p.person_id,
    w.weight_kg,
    h.height_cm,
    h.height_cm / 100.0 AS height_m,
    ROUND(w.weight_kg / POWER((h.height_cm / 100.0), 2), 2) AS bmi,
    w.mdate AS measurement_date,
    wu.concept_name AS weight_unit,
    hu.concept_name AS height_unit
FROM tpj.person p
JOIN weights w ON p.person_id = w.person_id AND w.rn = 1
JOIN heights h ON p.person_id = h.person_id AND h.rn = 1 AND h.mdate = w.mdate
LEFT JOIN vocab.concept wu ON w.unit_concept_id = wu.concept_id
LEFT JOIN vocab.concept hu ON h.unit_concept_id = hu.concept_id
WHERE p.person_id = {person_id}
ORDER BY w.mdate DESC
Test Cases:
- Weight 70 kg, Height 175 cm → BMI = 22.9 kg/m² (Normal weight)
- Weight 90 kg, Height 165 cm → BMI = 33.1 kg/m² (Obesity Class I)
Input Validation:
- Weight must be >0 and <500 kg
- Height must be >0 and <300 cm
- Weight and height measurements must be from the same date
The test cases are not optional. They're how you prove the formula behaves correctly before it runs against real patient data, and they're how a future analyst verifies that a formula change produces the expected delta. Click Create Calculation to save the measure to the library.
Viewing measure details
Click any measure card to open a detailed modal with complete clinical and technical documentation alongside live patient-level results.
Description section
Extended clinical documentation covers purpose, methodology, interpretation guidance, and usage notes - everything a new team member needs to understand the measure without tracking down the analyst who wrote it.
Cohort selector
Choose which patient population to compute the measure against:
- All Patients (default)
- Diabetes Cohort
- Obesity Management Program
- Heart Failure Registry
- (Any cohort defined in the system)
Scoping a measure to a cohort is how you move from "does this formula work?" to "what does this tell us about this specific population?" - the difference between technical validation and clinical insight.
Patient results table
Dynamically computed results for the selected cohort, with classification labels applied automatically from the thresholds defined in Step 3:
Example: BMI calculation results
| Patient ID | Name | Gender | Age | Evaluation Date | BMI (kg/m²) |
|---|---|---|---|---|---|
| P001234 | Patient A | F | 68 | 2024-12-15 | 33.1 (Obesity Class I) |
| P005678 | Patient B | M | 54 | 2024-12-14 | 22.9 (Normal) |
| P009012 | Patient C | F | 72 | 2024-12-13 | 36.8 (Obesity Class II) |
If no qualifying data exists - for example, no recent weight or height measurements - a "No Data" placeholder is shown.
Patient Metrics interface
The Patient Metrics tab is where clinical measures scale from individual patients to entire populations. Select a cohort, choose the measures you want to compute, and review every patient's results in a single structured table. This is the primary interface for quality reporting, research cohort characterization, and population health monitoring.
Workflow
Select Cohort
Choose patient population (e.g., 'Type 2 Diabetes Patients')
Select Metrics
Click 'Select Metrics' and choose measures (e.g., HbA1c, BMI, Blood Pressure, LDL Cholesterol)
Apply Filters (Optional)
Refine population by age, gender, or other demographics
Review Results
View patient-level calculations in structured table, export for analysis
Results table
Every selected measure appears as a column, computed for each patient in the cohort at the same evaluation date:
Example: Diabetes cohort with multiple measures
| Patient ID | Age | Gender | HbA1c (%) | BMI (kg/m²) | SBP (mmHg) | LDL (mg/dL) |
|---|---|---|---|---|---|---|
| P001234 | 68 | F | 9.2 | 33.1 | 145 | 142 |
| P005678 | 54 | M | 7.8 | 22.9 | 138 | 98 |
| P009012 | 72 | F | 10.1 | 36.8 | 152 | 156 |
Each column represents a different clinical measure computed for the same evaluation date.
This output is ready for export to R, Python, or external analytics platforms. The underlying data is already standardized to OMOP CDM, so the results are consistent regardless of which source systems the patient data originated from.
Select Metrics modal
Fine-grained control over which measures appear in the results table:
- Bulk select/deselect: Toggle all measures at once
- Search: Filter by measure name or clinical domain
- Preview: View name and short description before selecting
- Checkbox toggle: Include or exclude individual measures
Changes apply immediately.
Best practices for measure design
Building a durable, reusable measure library requires more than correct SQL. The practices below separate calculations that survive one project from ones that serve your organization for years:
Standardized naming
Use consistent naming conventions across clinical domains. Include units where applicable (e.g., 'BMI (kg/m²)' or 'HbA1c (%)').
Validated formulas
Define clinically validated formulas with test cases demonstrating expected outputs for known inputs.
Reference ranges
Document normal ranges, abnormal thresholds, and units to support clinical interpretation.
Clinical evidence
Link to peer-reviewed literature, clinical guidelines, or institutional protocols supporting the measure.
Input validation
Implement technical guardrails preventing invalid inputs (e.g., negative weights, impossible vital signs).
Discoverability
Use category tags and detailed descriptions to improve measure discovery across teams.
Usage documentation
Provide clear guidance for when, how, and why to use each measure in clinical and analytics workflows.
Version control
Track changes to formulas and thresholds over time, maintaining reproducibility for historical analyses.
What this makes possible across the platform
A well-maintained Clinical Measures library becomes the computational foundation for analytics across Patient Journey Intelligence. The same validated definitions power every downstream application:
Quality measurement
Track HEDIS, CMS, and institutional quality metrics with standardized, auditable calculations.
Research cohorts
Define inclusion criteria using validated measures, ensuring reproducible cohort selection.
Risk stratification
Apply consistent risk scores and clinical thresholds across patient populations.
Longitudinal tracking
Monitor patient trajectories over time using standardized calculations at each timepoint.
Decision support
Power clinical alerts, recommendations, and treatment pathways with real-time measure evaluation.
Regulatory reporting
Generate compliant reports using measures with documented evidence and validation.
Every result is traceable from the patient-level value back through the SQL logic, the clinical thresholds, and the evidence that justified them. That chain of provenance is what makes findings defensible in quality audits, IRB reviews, and regulatory submissions.
The Clinical Measures module is a centralized repository for defining, validating, and computing clinical calculations directly on OMOP CDM v5.4 data. It lets healthcare organizations create measures once - with SQL logic, clinical documentation, reference ranges, and evidence links - and apply them consistently across cohorts, quality programs, registries, and research studies.
When Step 7 is enabled, the backend pipeline runs automatically at the end of each ingestion cycle. It refreshes materialized views, builds ERA inputs, computes all active calculators for the ingestion cohort, validates results, and stores patient-level values with historical retention for trend analysis. Dashboards and patient views update automatically on completion.
The library includes validated calculations across specialties - BMI, eGFR, HbA1c control status, CHADS₂-VASc, blood pressure classification, and more. Every measure includes clinical documentation, reference ranges, evidence links, and SQL logic validated against known test cases. You can also define custom measures for organization-specific or study-specific calculations.
Open the Patient Metrics interface, select the cohort you want to evaluate, then choose the measures to compute using the Select Metrics modal. Results appear in a structured table with one column per measure. You can apply demographic filters and export results for external analysis.
HEDIS and CMS quality metrics are defined as standard measures in the library with the exact thresholds and logic required for regulatory submission. Because every measure runs against OMOP CDM data with full provenance, results are auditable and reproducible - the calculation traces back to source documents, and the formula links to the guideline that defines it.
The module enforces a single definition per measure. Once "Diabetes Control Status" is defined with an HbA1c threshold of 9% per ADA guidelines, every team - quality, research, clinical - queries the same SQL logic and threshold. There is no parallel version in a spreadsheet or a separate analyst's script; the library is the authoritative source.
Yes. The backend pipeline retains historical values with each ingestion cycle, so you can track trajectories - HbA1c trends over six months, BMI progression across care encounters, eGFR decline over years. This longitudinal view is available in patient-level results and exportable for research or quality monitoring.
The five-step creation workflow requires test cases before the measure is saved. You define known inputs and expected outputs - for example, weight 70 kg and height 175 cm should produce BMI 22.9. These cases run against the SQL logic during creation, catching formula errors before the measure is applied to real patients.