Demos
Demos


Note: throughout the examples in this article the code shown is meant to run on a Jupyer notebook to enable the same visualizations that are explained.
The main idea behind OCR is converting images of printed/handwritten types into digital text. Visual NLP’s ImageToTextV2 is a transformer-based, state-of-the-art encoder-decoder model enhanced for accuracy, speed, and scalability by John Snow Labs.

Architecture for a popular Transformer based OCR: TR-OCR
This article will explore how Visual NLP enables the utilization of this type of model at scale in an Apache Spark Cluster. We will cover,
- The ImageToTextV2 annotator and its parameters.
- Example Code.
- Optimal parameters both for CPU and GPU.
- Checkpoints, Accuracy + Performance benchmarks and key takeaways.
ImageToTextV2 (OCR)
Probably you are already familiar with the general architecture of John Snow Labs Spark NLP pipelines, a project that is related to Visual NLP. If you are not, you can check this tutorial.
The idea is simple: in a Visual NLP pipeline, multiple transformations are chained together one after the other by connecting the outputs of one stage to inputs in the next stages. The stages, or annotators are the building blocks for your pipeline. In this section, we will focus on the ImageToTextV2 annotator.
ImageToTextV2 receives the following inputs:
- A binary image containing text; can be independent words or an entire page. More on this soon.
- Optional regions; these are bounding boxes that correspond to either text chunks inside the image(typically patches of two or more words), or an empty regions list for the case in which the image fed to ImageToTextV2 corresponds to individual chunks inside the image.
So basically, there are two ways this can operate; cropping text chunks from an image using ImageSplitRegions or on independent images representing text chunks. Let’s take a walk through the parameters supported by this annotator.
ImageToTextV2 (OCR) Parameters
- lineTolerance (Type: Integer, Default: 15) → Used to group Coordinates into lines, and to assemble the final text representation. It’s a pixel value for the distance between two lines of text above which the lines will be considered to be separate lines. In case you have images with varying degrees of spaces between lines, you can set this Param to 0, this will allow ImageToTextV2 to calculate the best line tolerance for you.
- maxImageRatio(Type: Float, Default: 11.25) → The maximum value for the width/height ratio of images fed to the model, in case grouping is enabled.
- groupImages (Type: Boolean, Default: True) → Whether to group images after cropping to maximize detection quality.
- batchSize (Type: Int, Default: 3) → Number of image patches to feed to the model simultaneously. Use a larger batch size if you want to speed up processing in GPU.
- taskParallelism (Type: Int, Default: 8) → The number of threads to use while processing a single region. This controls the thread parallelism that happens on each cluster node.
- useGPU (Type: Boolean, Default: False) -> Whether to enable GPU for computations.
- useCaching (Type: Boolean, Default: True) → Whether to enable caching in the decoding stage, resulting in faster inference.
- inputCols (Type: Array[String], Default: Array[image]) → Name of the column containing the image in the input dataframe.
- regionsCol (Type: String, Default: region) → Name of the column containing text coordinates in the dataframe. If the images are split on word/line level and there are no coordinates, you can set the region column to null.
- outputFormat (Type: Enum, Default: OcrOutputFormat.TEXT) -> The output format of the detected text.
- positionsCol (Type: String, Default: positions) → Name of the column containing the positions of the detected text as PageMatrix objects.
Example Pipelines for ImageToTextV2 (OCR)
In this example, we’ll first read an image from the IAM dataset as a binary file. Then, we’ll convert it into a 3-channel image using the BinaryToImage annotator. Finally, we’ll view the image with the help of the display_images utility function.
from sparkocr.transformers import BinaryToImage
from sparkocr.enums import ImageType
from sparkocr.utils import display_images

imagePath = "../n02-009-06.png"
df = spark.read.format("binaryFile").load(imagePath)

#convert binary Content into image
binary_to_image = BinaryToImage() \
    .setInputCol("content") \
    .setOutputCol("image") \
    .setImageType(ImageType.TYPE_3BYTE_BGR) #Convert image into BGR format

#Transform binary data into a well parsed image
imageDf = binary_to_image.transform(df).cache()

#View Image
display_images(imageDf,"image")

ImageToTextV2 (OCR) with no regions present
As this image has “cropped” text, meaning it’s not an entire page, we can apply the ImageToTextV2 annotator without input regions, to do so we can pass a non-existent column name as input.
from sparkocr.enums import OcrOutputFormat
from sparkocr.transformers.recognizers import ImageToTextV2

#Using ImageToTextV2 to detect text using image and null regions
checkpointName = "ocr_large_handwritten_v2"

ocr = ImageToTextV2() \
    .pretrained(checkpointName, "en", "clinical/ocr") \
    .setInputCols(["image","regionEmpty"]) \
    .setOutputCol("detected_text") \
    .setBorderWidth(10) \
    .setUseGPU(True) \
    .setUseCaching(True) \
    .setOutputFormat(OcrOutputFormat.TEXT)

#Detect text from single image with no regions
result = ocr.transform(imageDf).select("detected_text").collect()

#Lets print the Output stored in detected_text column
print(result[0].asDict()["detected_text"])

"""Output --> said the first thing that came into her head ."""
ImageToTextV2 (OCR) with regions present
Now, let’s look into the situation in which we have an entire page of text. First, we’ll use the ImageTextDetector annotator to find word regions in the image. Then, the output regions will be fed to the ImageToTextV2 annotator to recognize text from those regions. Finally, we can use the ImageDrawRegions to draw bounding boxes around the detected words on the image.
from sparkocr.enums import Color, OcrOutputFormat
from sparkocr.transformers.recognizers import ImageToTextV2
from sparkocr.transformers.detectors import ImageTextDector
from sparkocr.transformers import ImageDrawRegions
from pyspark.ml import PipelineModel

# Using ImageTextDetector to detect regions
text_detector = ImageTextDetector() \
    .pretrained("image_text_detector_opt", "en", "clinical/ocr") \
    .setInputCol("image") \
    .setOutputCol("detected_regions") \
    .setWithRefiner(False)

# Using ImageToTextV2 to detect text using image and regions
ocr = ImageToTextV2() \
    .pretrained("ocr_large_handwritten_v2", "en", "clinical/ocr") \
    .setInputCols(["image"]) \
    .setRegionsColumn("detected_regions") \
    .setBorderWidth(10) \
    .setOutputCol("detected_text") \
    .setUseGPU(True) \
    .setUseCaching(True) \
    .setOutputFormat(OcrOutputFormat.TEXT)

# Using ImageDrawRegions to view detected regions
draw_regions = ImageDrawRegions() \
    .setInputCol("image") \
    .setInputRegionsCol("detected_regions") \
    .setOutputCol("image_with_regions") \
    .setRectColor(Color.green) \
    .setRotated(True)

# Let's put everything together in a Pipeline Model
pipeline = PipelineModel(stages=[
    text_detector,
    ocr,
    draw_regions
])

# Lets call the pipeline
result = pipeline.transform(imageDf)

# Lets check the detected text from OCR
print(result.collect()[0].asDict()["detected_text"])

"""Output --> said the first thing that came into her head"""

# Let's check the detected regions on image
display_images(result,"image_with_regions")

The code is self-explanatory; we have some imports, and we define components of our pipeline, namely ImageTextDetector, ImageTextDetector, and ImageDrawRegions. At this point, it’s worth noticing that some of the components in the pipeline call the pretrained() method. These come from the John Snow Labs Models Hub, which is a valuable resource for pretrained models.
We then completed the job by printing the recognized text to standard output and displaying the image regions that ImageTextDetector was able to recognize.
Optimal Parameters for CPU and GPU Inference (Collected using Databricks)
In this section, we describe the best parameters for both CPU and GPU.
Cluster Configuration for CPU
- Runtime Version → 10.4 LTS (Spark 3.2.1 and Scala 2.12) with Photon Acceleration Enabled
- Worker Type → i3.xlarge (30.5 GB Memory, 4 Cores, 30 Workers, 120 Cores)
- Driver Type → i4i.xlarge (32 GB Memory, 4 Cores)
- Cost → 62.76 DBU/h
Best Parameters for CPU
- To balance the computational load, ensure the number of partitions in the dataframe is 2–3 times the total number of worker cores available.
- Set the batchSize to match the number of cores in the driver.
- Keep taskParallelism lower than the worker cores to distribute tasks effectively.
- Enable caching for faster inference.
- Enhance accuracy and detection quality by enabling groupImages.
Cluster Configuration for GPU
- Runtime Version → 10.4 LTS ML (Spark 3.2.1, Scala 2.12, GPU)
- Worker Type → g5.xlarge (16GB Memory, 1 GPU, 10 Workers, 40 Cores)
- Driver Type → g5.xlarge (16GB Memory, 1 GPU, 4 Cores)
- Cost → 14.96 Dbu/h
Best Parameters for GPU
- To optimize memory usage and prevent CUDA from running out of memory, set the number of partitions in the dataframe to 1–2 times the total number of workers available. Generally, a smaller value is better.
- Set the batchSize to match the number of cores in the driver.
- Keep taskParallelism lower than the worker cores to distribute tasks effectively.
- Speed up computation by activating useGPU.
- Enable caching for faster inference.
- Enhance accuracy and detection quality by enabling groupImages.
Benchmarks And Checkpoints
When evaluating accuracy benchmarks with Character Error Rate (CER), utilising a mix of printed and handwritten datasets such as FUNSD, SROIE, and IAM is essential. This diverse dataset selection comprehensively assesses OCR performance across various text types and handwriting styles.
- Printed → Images with typed text.
- Handwritten → Images with handwritten, penmanship and cursive text.
For the IAM, SORIE and FUNSD datasets, we’ll assess the Character Error Rate (CER) metrics for both CPU and GPU computes, with switching caching.

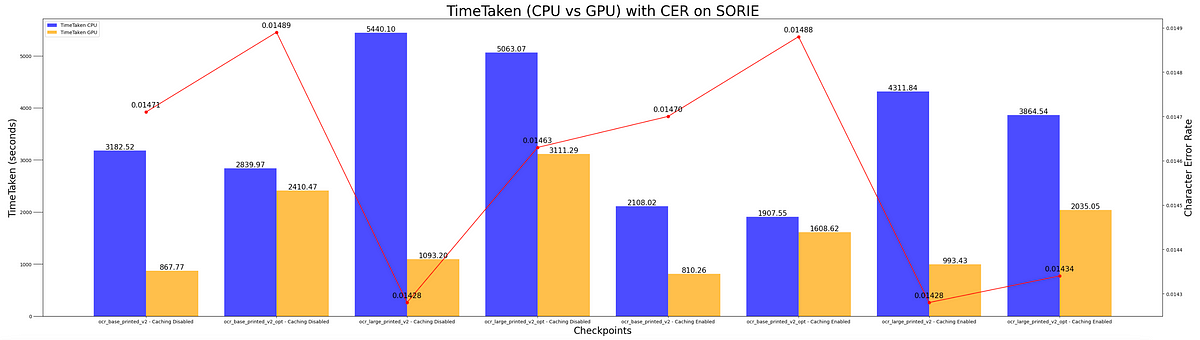
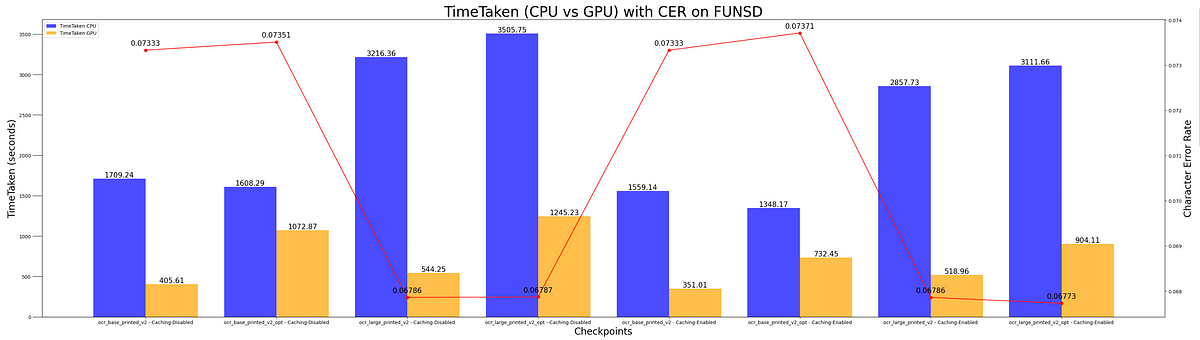
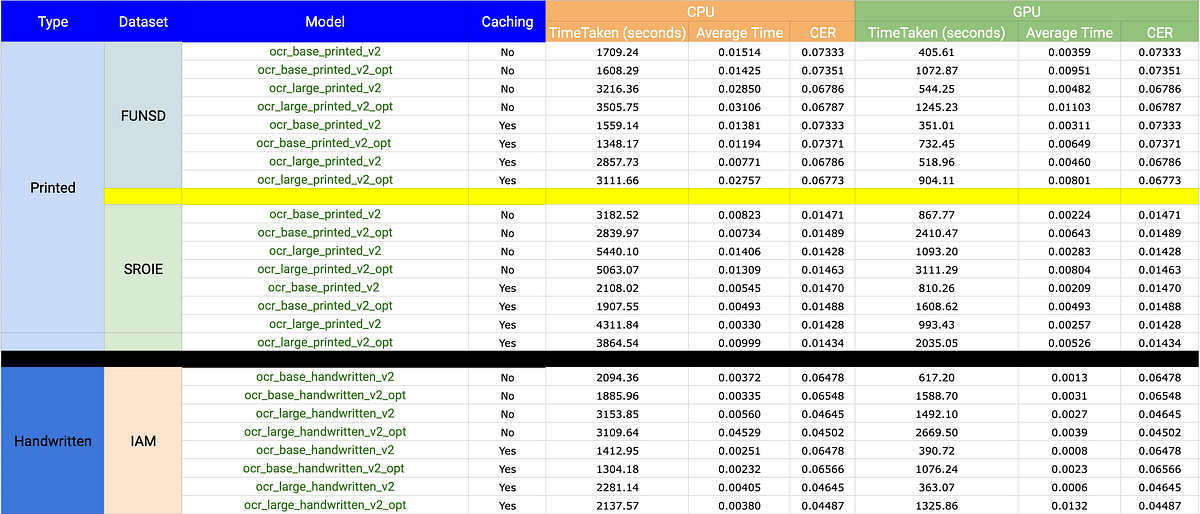
Next, we put everything together in this final chart showing both accuracy and runtime metrics for all datasets, CPU and GPU.
Key Takeaways
Finally, we summarize the best practices that we’ve learned from applying the pipeline to all these datasets.
- The Dbu/h is four times higher for CPU compared to GPU, with no variance in accuracy. Utilizing GPU can achieve identical outcomes at one-fourth of the cost. GPU is your friend!
- “base” checkpoints require less time and yield a lower accuracy when compared to the “large” checkpoints. The latter is slower but offers higher accuracy.
- Enabling “caching” can reduce the time taken during inference across checkpoints.
Summary
In this brief article, we have explored the basic setup for an OCR pipeline using Visual NLP. We have also learned about different parameters to control the detection process, and we have finalized the article with some experimental results & best practices for you to get the most out of your money and time when applying these tools to real problems.