


Introduction and definitions
The second part of the article series having as common theme (a set of) Medicare indicators, is based on the same data provided by The Centers for Medicare and Medicaid Services, through The Physician and Other Supplier Public Use File (The Physician and Other Supplier PUF) and is dedicated to the geographical variations of the Medicare financial indicators levels. As already mentioned in the previous article, the data from The Physician and Other Supplier PUF is covering a broad spectrum of variables related to Medicare healthcare services providers, utilization, payment and submitted charges. The source of data included are the CMS administrative claims data about the beneficiaries enrolled in the Medicare fee-for-service program.
In the first part of the series, we mentioned that The Centers for Medicare and Medicaid Services developed the Healthcare Common Procedure Coding System (HCPCS), a set of codes useful to identify medical procedures and services. The health services providers are using the coding system to generate invoices and insurance claims, associated with a total monetary value represented by the submitted charges. Centers for Medicare and Medicaid Services (CMS) establishes the total Medicare allowed amount for every procedure and service covered by the program. Based on the Medicare insurance claim the health services providers receive reimbursements represented by the Medicare payment amount. According to CMS, the standardized payment amounts are Medicare payment amounts adjusted for geographic differences in payment rates.
John Snow LABS included in its library the data provided by CMS through The Physician and Other Supplier PUF, after a process of data curation and enhancement, having as purpose to accelerate the utilization and understanding this data package for the above-mentioned categories of users.
Overview on Medicare financing in 2015
The current article is offering insights for the geographical variations at a state level for the total Medicare allowed amount, total payment amount, total submitted charges and total Medicare standardized payment amount.
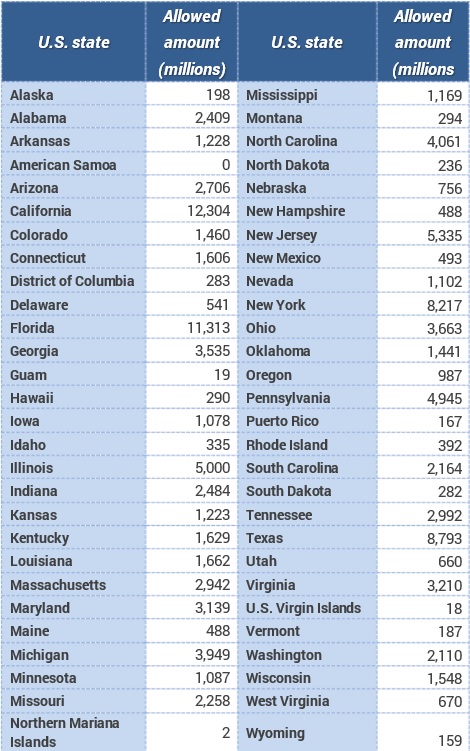
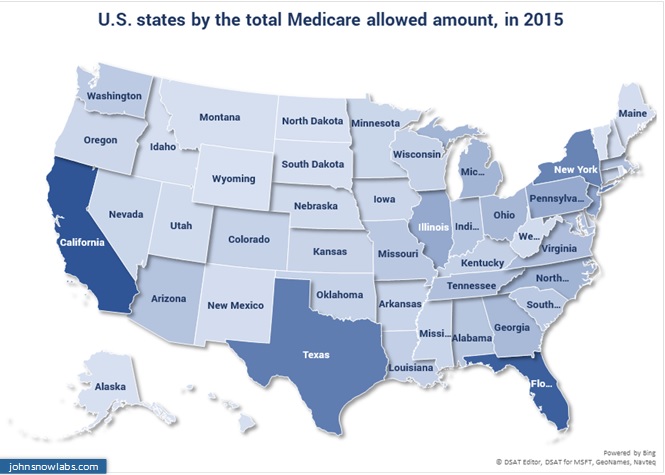
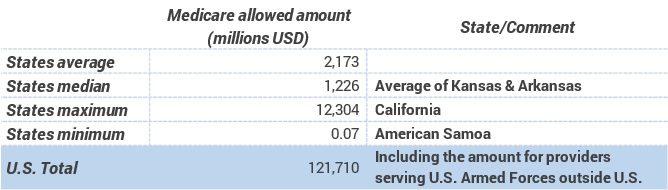
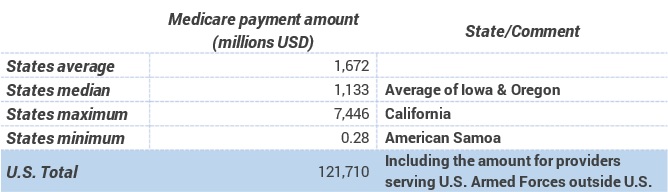
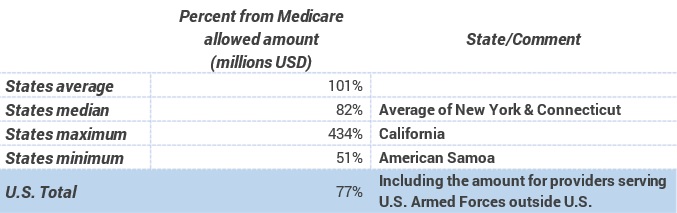
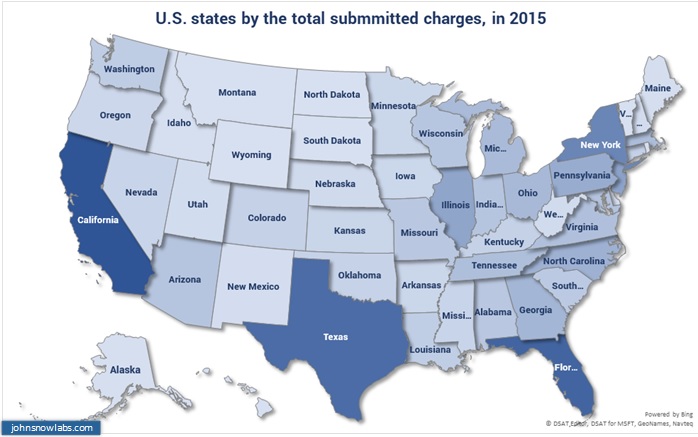
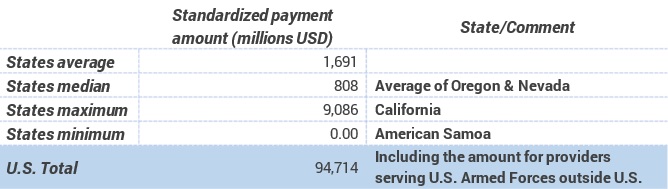
In 2015 the total Medicare allowed amount was of almost 122 billion dollars and of over 2 billion for each state (including equivalent territories), on average. The Medicare allowed amount for California, of over 12 billion dollars was the largest (6 times more than state average). The total submitted charges for the healthcare services offered to the Medicare patients (beneficiaries) was of almost 350 billion dollars, 2.9 more than the Medicare allowed amount. The total Medicare payment amount was of 93 billion dollars, 29 billion dollars (27%) less than the total Medicare allowed amount and with 257 billion dollars (77%) less than the total submitted charges. Again, California is the state with the largest total submitted charges of almost 35 billion dollars (10% of U.S. total) and with the largest Medicare payment amount 7.5 billion dollars (8% of U.S. total). The total standardized Medicare payment amount was of almost 95 billion dollars.
The healthcare providers and services set of indicators
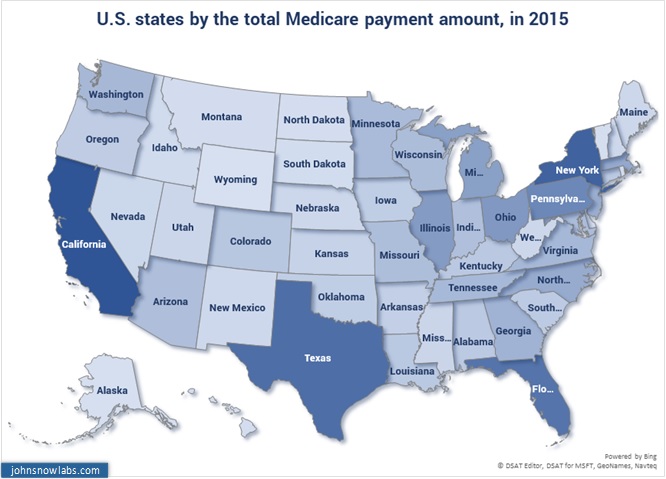
3.1 The total Medicare allowed amount by states, in 2015
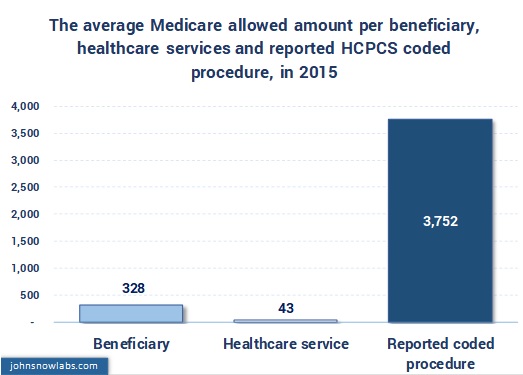
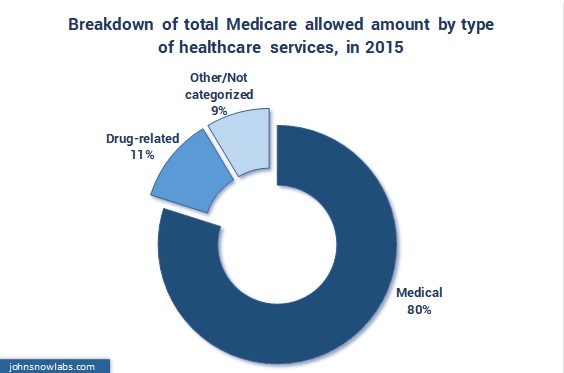
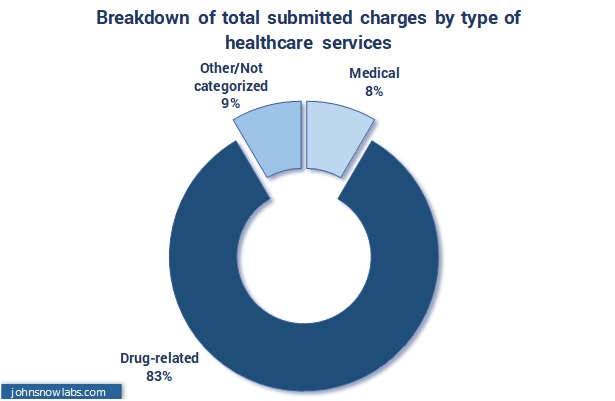
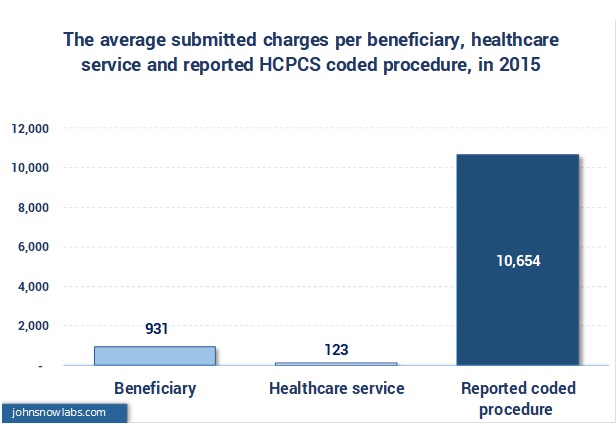
3.2 The total Medicare allowed amount by healthcare services type and the average Medicare allowed amount per beneficiary, healthcare service and per reported HCPCS procedure, in Healthcare services by healthcare providers speciality, in 2015
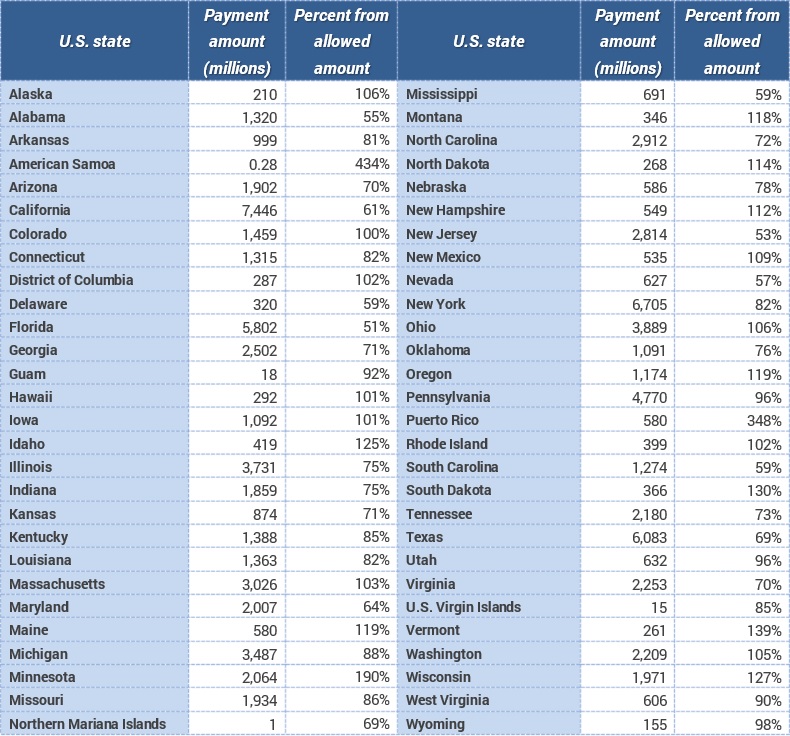
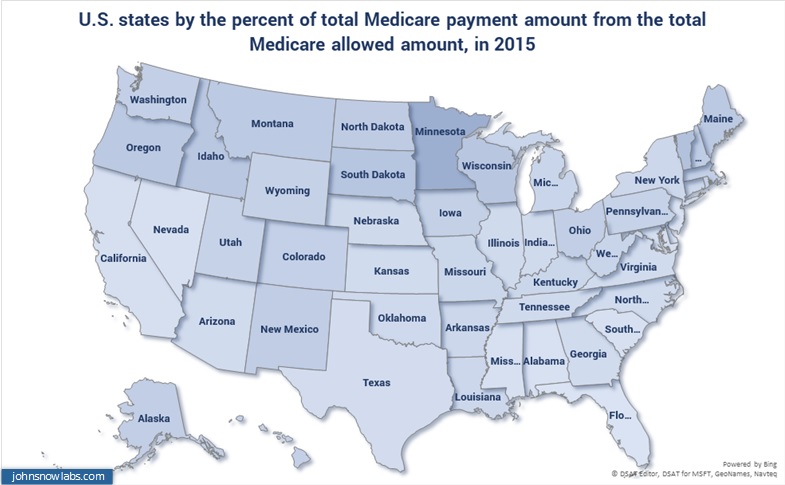
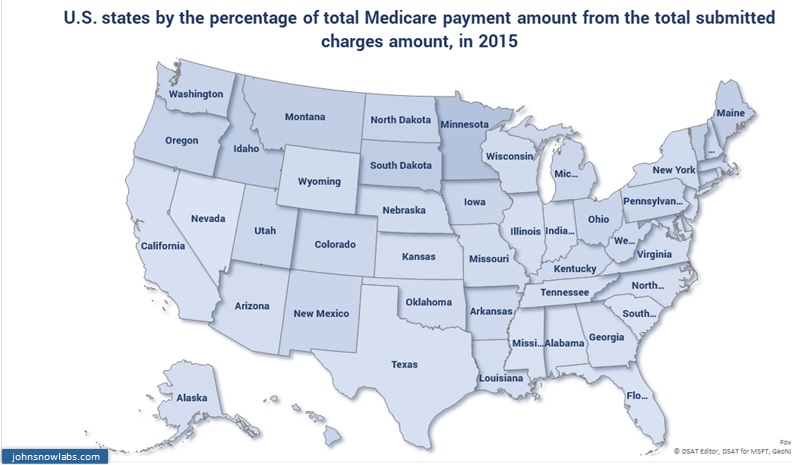
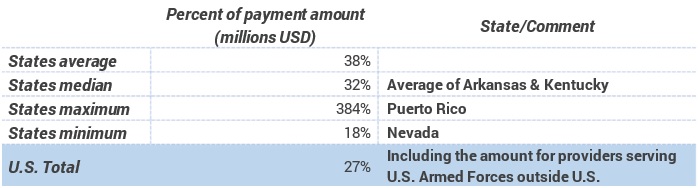
3.3 The total payment amount and the percentage of total Medicare payment amount from total Medicare allowed amount by states, in million USD, in 2015
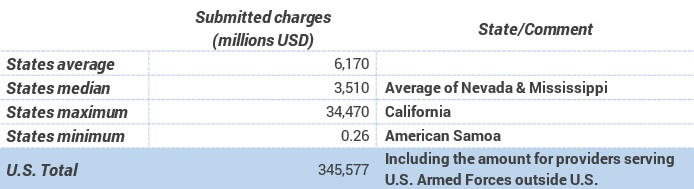
3.4 The total submitted charges and the percentage of total submitted charges from total payment amount by states, in million USD, in 2015
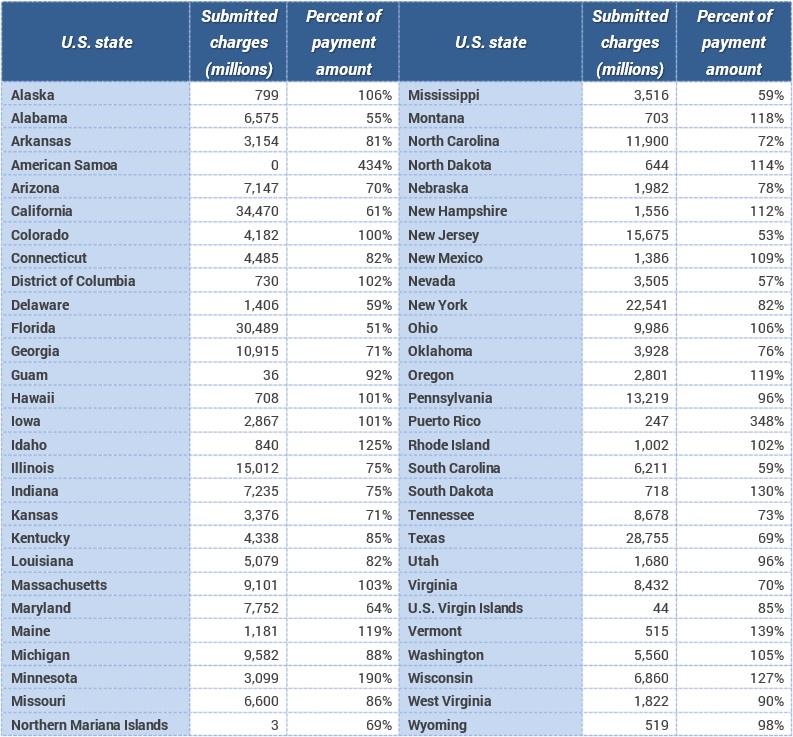
3.5 The total submitted charges and the percentage of total submitted charges from total payment amount by states, in million USD, in 2015
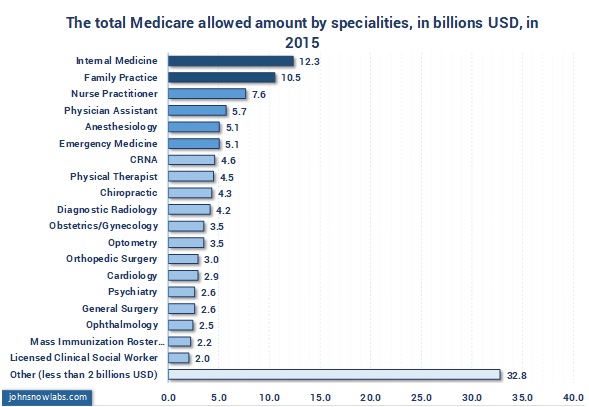
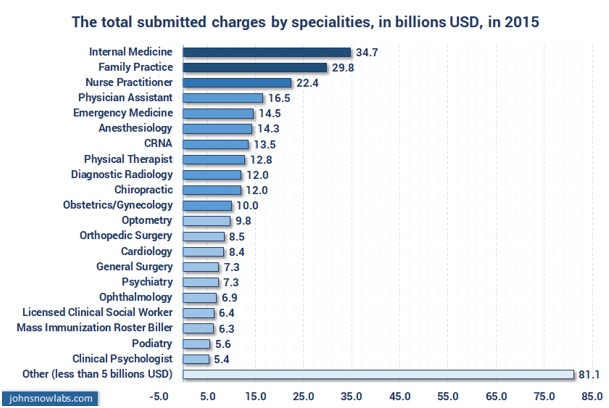
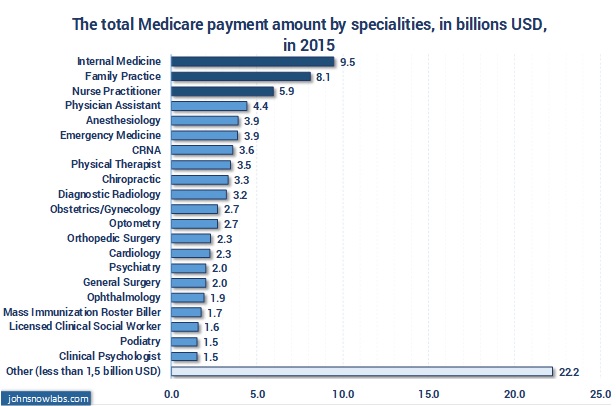
3.6 The total Medicare allowed amount, total submitted charges and total Medicare payment amount (in billions) by the provider specialities, in 2015
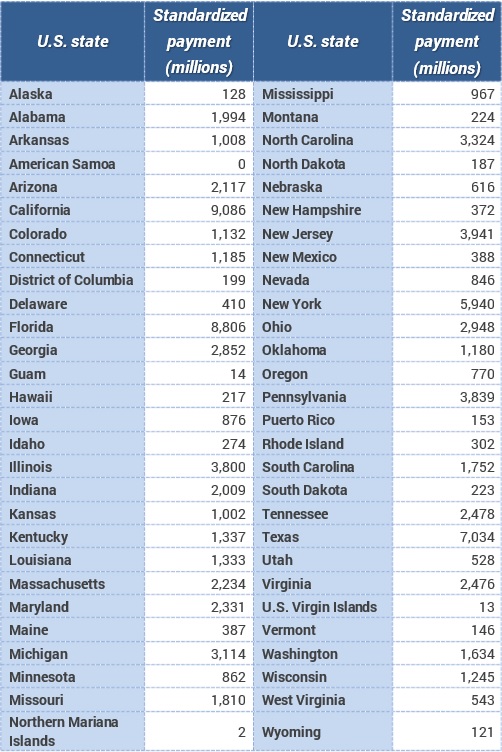
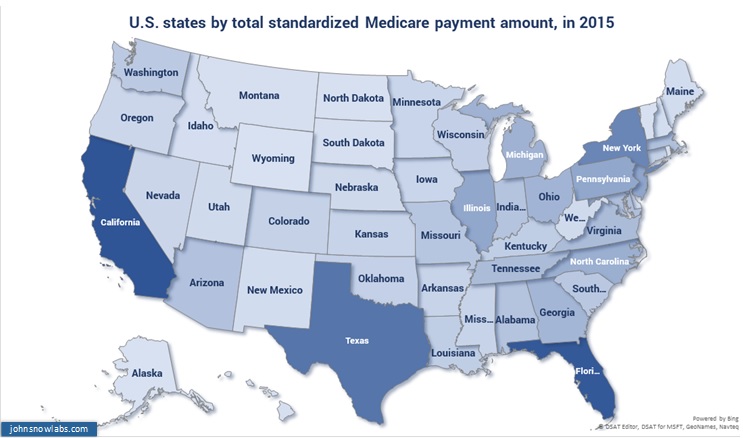
3.7 The total standardized Medicare payment amount by states, in million USD, in 2015
(only specialities with 2% or more of the total Medicare allowed amount, total submitted charges and respectively total Medicare payment amount)
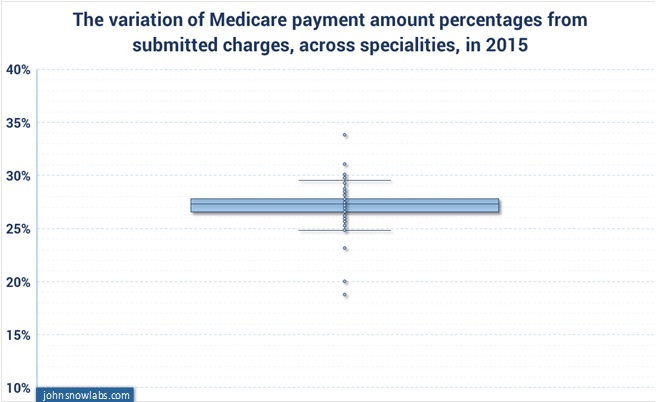
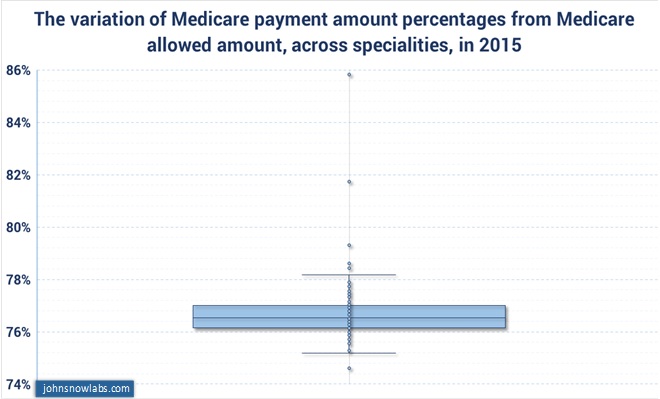
3.8 The variation of Medicare payment amount percentages from Medicare payment amount and submitted charges per speciality, in 2015
To enhance patient engagement and support decision-making in healthcare, technologies like Generative AI in Healthcare and Healthcare Chatbot are becoming increasingly valuable.