NLP Lab version 4.9 is now available with new features to enhance the analytics capabilities of the platform. The latest release provides managers with more insights into their projects and team productivity, enabling more efficient progress monitoring and better DL model outcomes. The addition of Time Indicators and Edit Counts on each annotation version is a notable feature that allows annotators to track statistics of the edits made in the completions, providing them with valuable insights into their work and the evolution of the Annotation Guidelines.
To ensure that labeling page space is used optimally, the layout has been improved to use every corner of the page. This means that the labeling page now provides a more streamlined and efficient experience for users. In addition, the new version includes bug fixes and stabilization, which are customary in every software release. These features are designed to enhance the user experience and improve the accuracy and efficiency of NLP Lab. Here are the highlights of this release:
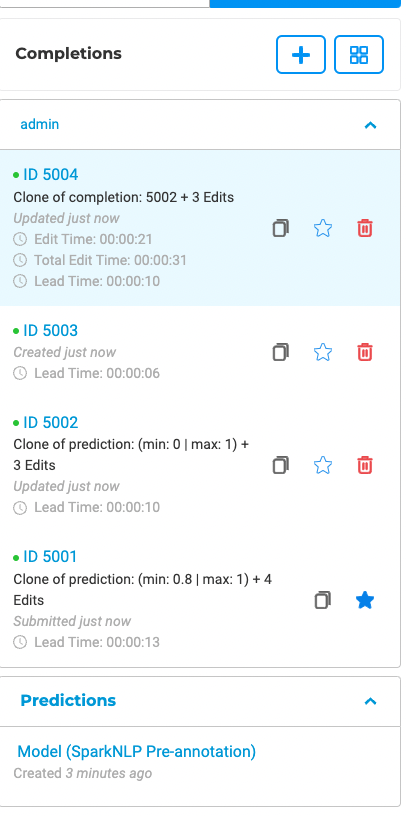
Enhanced Annotation Process Monitoring through Edit Time Indicators
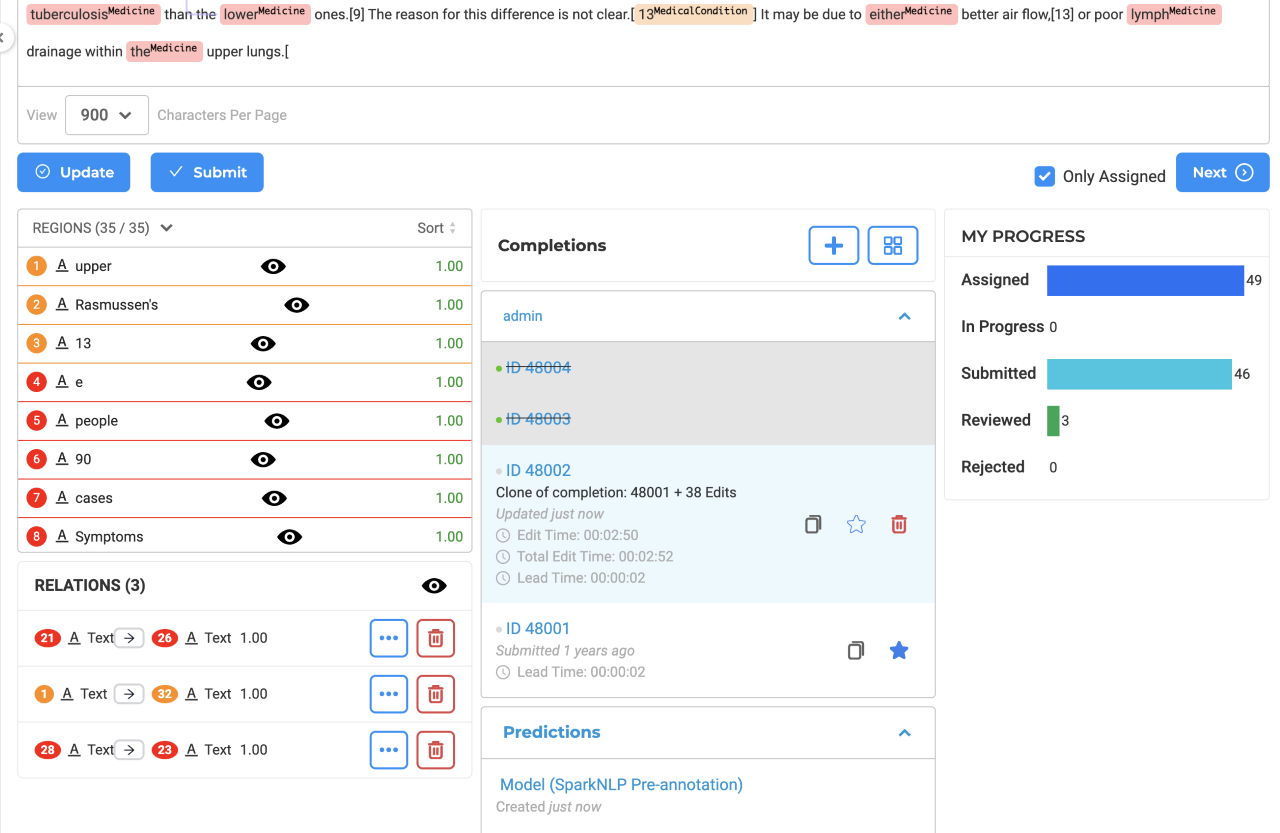
This version allows users to view the time taken to finalize a completion and the number of edits made to any version of annotations, providing more transparency in the annotation NLP process. The feature introduces two new terms, “Lead Time” and “Edit Time.” “Lead Time” refers to the time taken to annotate a completion, whether from scratch or cloned from a prediction. “Edit Time” represents the time invested in annotating a cloned completion. In addition to this, users can also see the number of modifications made to cloned completions. This feature can help managers track the time invested in various phases of completion and help in optimizing the annotation process.
Tracking of Annotation Versions and Edits
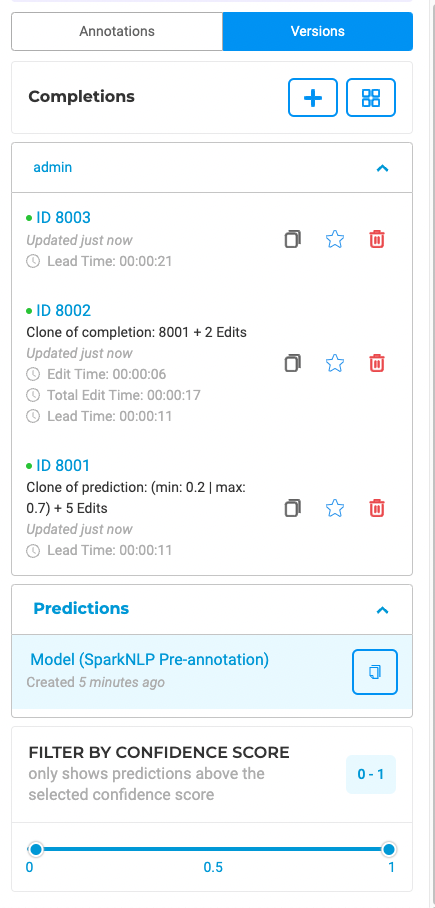
The latest update includes a new feature aimed at providing users with a more comprehensive understanding of completion progress and edit history. By utilizing the Versions tab, users can now track the source of a copied completion as well as the number of edits made between consecutive completions. This allows users to easily monitor the evolution of a completion and better understand the amount of work required for each completion. When a completion is created based on a filtered prediction or cloned from an existing completion, the number of edits made to the previous version will be displayed. Additionally, for completions based on predictions, the confidence score range selected will be available in the format of (min: 0 | max: 1) for copied completions. This feature is
designed to provide greater transparency in completion progress and streamline the tracking of edit history.
New Analytics Update: Enhanced Charts Provide Managers with Deeper Insights into Project Performance
NLP Lab 4.9.0 includes several improvements aimed at enhancing the user experience and efficacity of analytics charts.
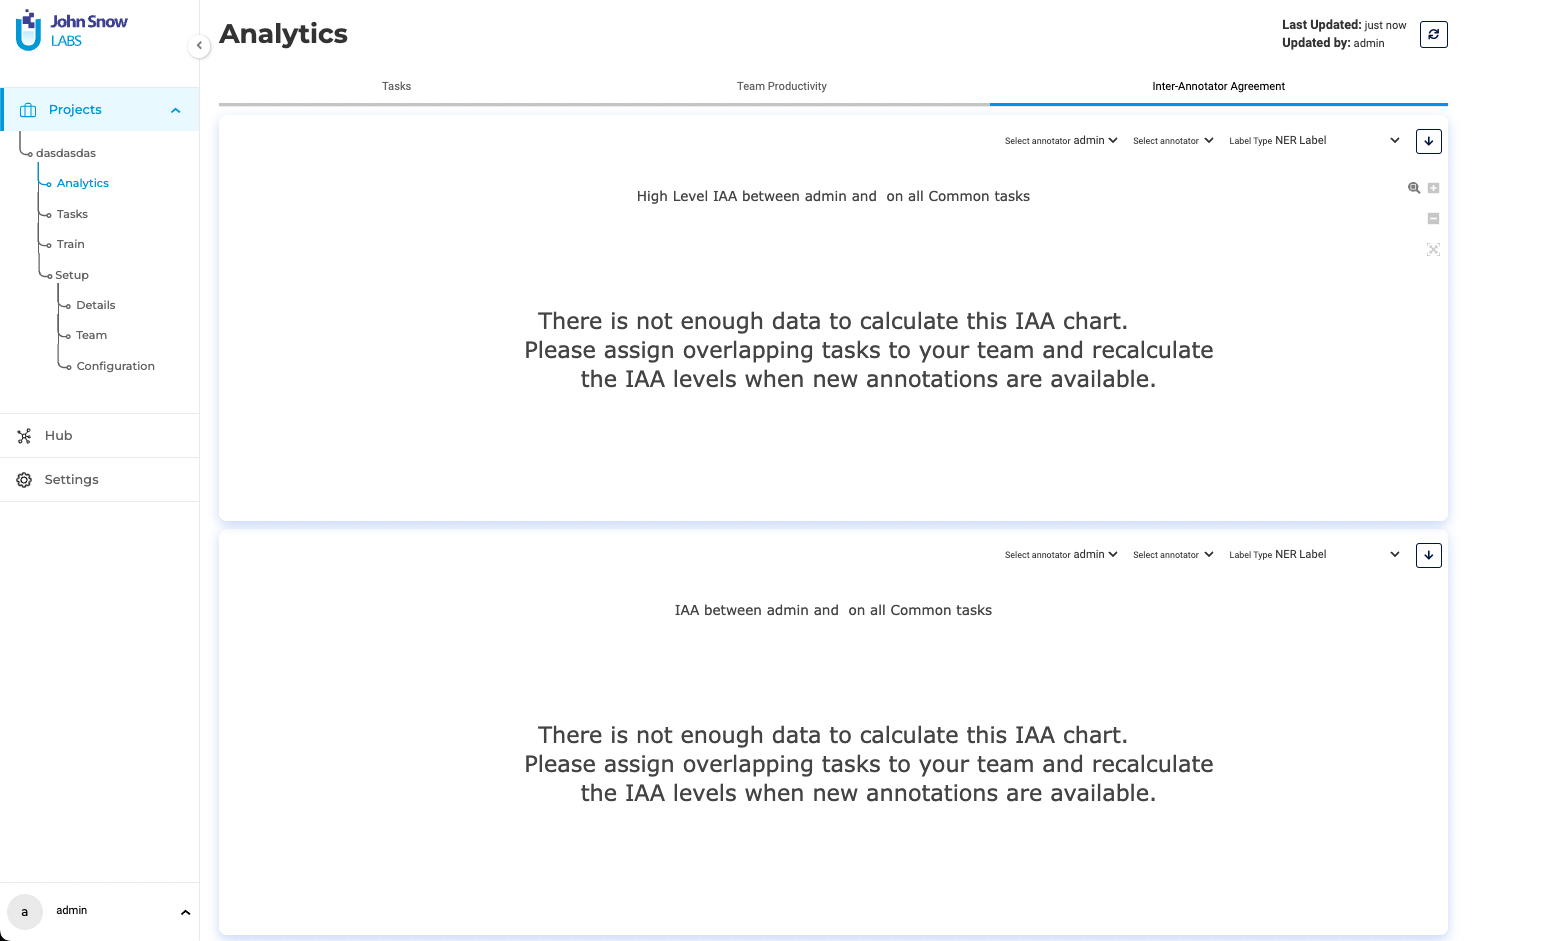
Improvements have been made to the Inter-annotator Agreement (IAA) charts. In cases where there is an insufficient amount of data to populate the IAA charts due to non-overlapping tasks completed by users, the UI now displays a message that informs the user that there is not enough data available to calculate the IAA chart. This enhancement aims to improve the transparency of IAA charts by alerting users to any insufficient data, providing guidance on how to resolve the issue, and promoting the assignment of overlapping tasks to ensure the availability of sufficient data.
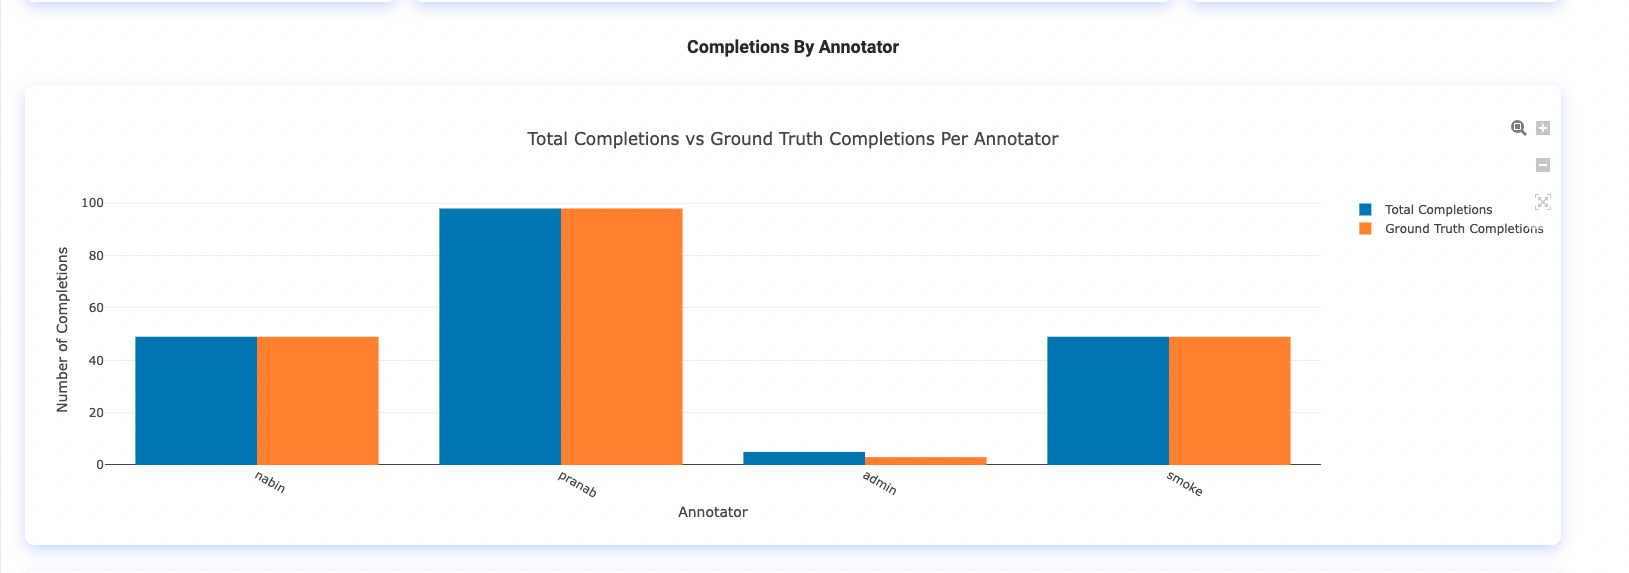
Updates were made to the Total number of completions per annotator chart. The chart has been renamed as “Total Completions vs Ground Truth Completions Per Annotator” to provide a more accurate description of the data it represents. The chart now includes two columns for each annotator, displaying the total number of completions and the number of ground truth completions side by side. This enhancement is designed to provide users with a more detailed and accurate understanding of the number of draft completions, helping them to track successive changes/corrections on the same tasks and address discrepancies in their work productivity.width=”1629″ height=”573″ />
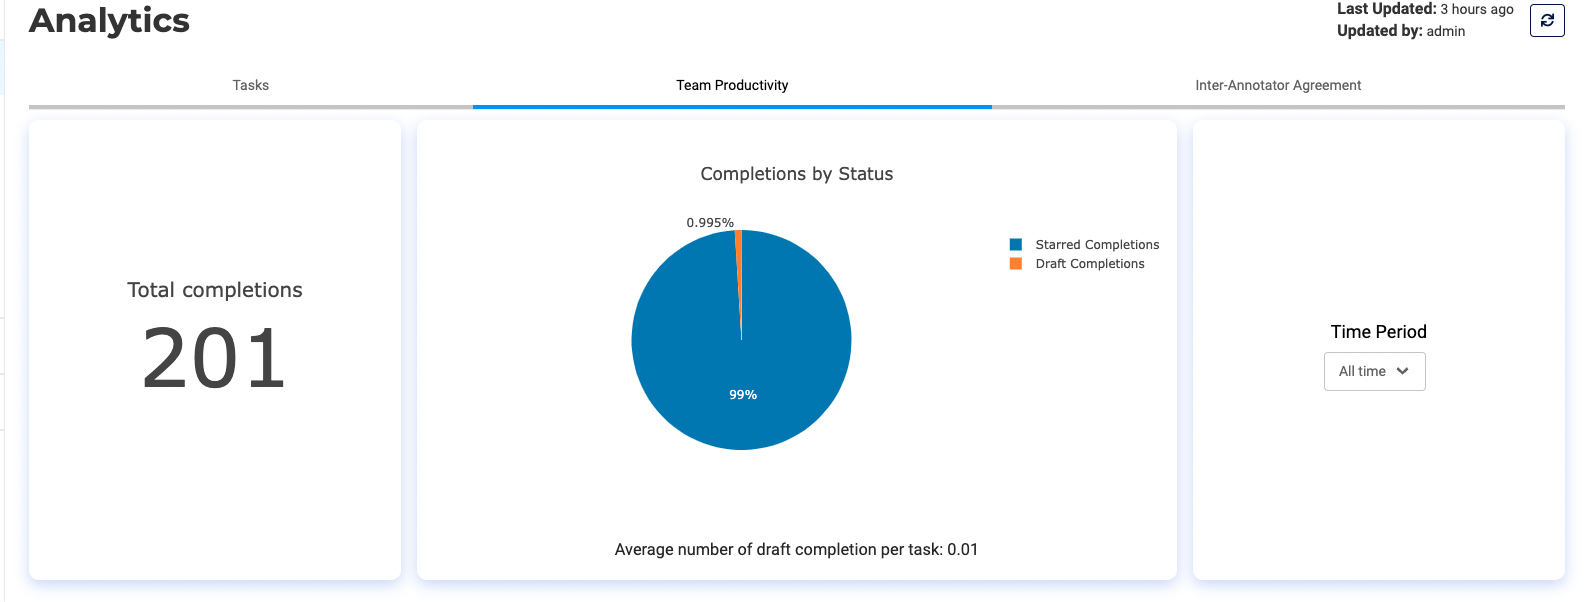
This version includes a new “Completion By Status” pie chart. This chart provides users with a visual representation of the statuses of completions in their projects. The chart displays two categories of completions: ground truth completions (indicated by a star) and draft completions. The pie chart also includes a new text description at the bottom of the chart informing users on the average number of draft completions per task. This feature aims to provide users with a better understanding of the number of edits and corrections required to complete a task and how the number of corrections affects the project’s overall completion rate. Additionally, the Team Productivity section has been reorganized to provide a more user-friendly experience. The Total completions, Completion by status, and Time Period have been added as three separate columns in a single row. This new layout aims to make it easier for users to access the information they need and provides a more streamlined experience.
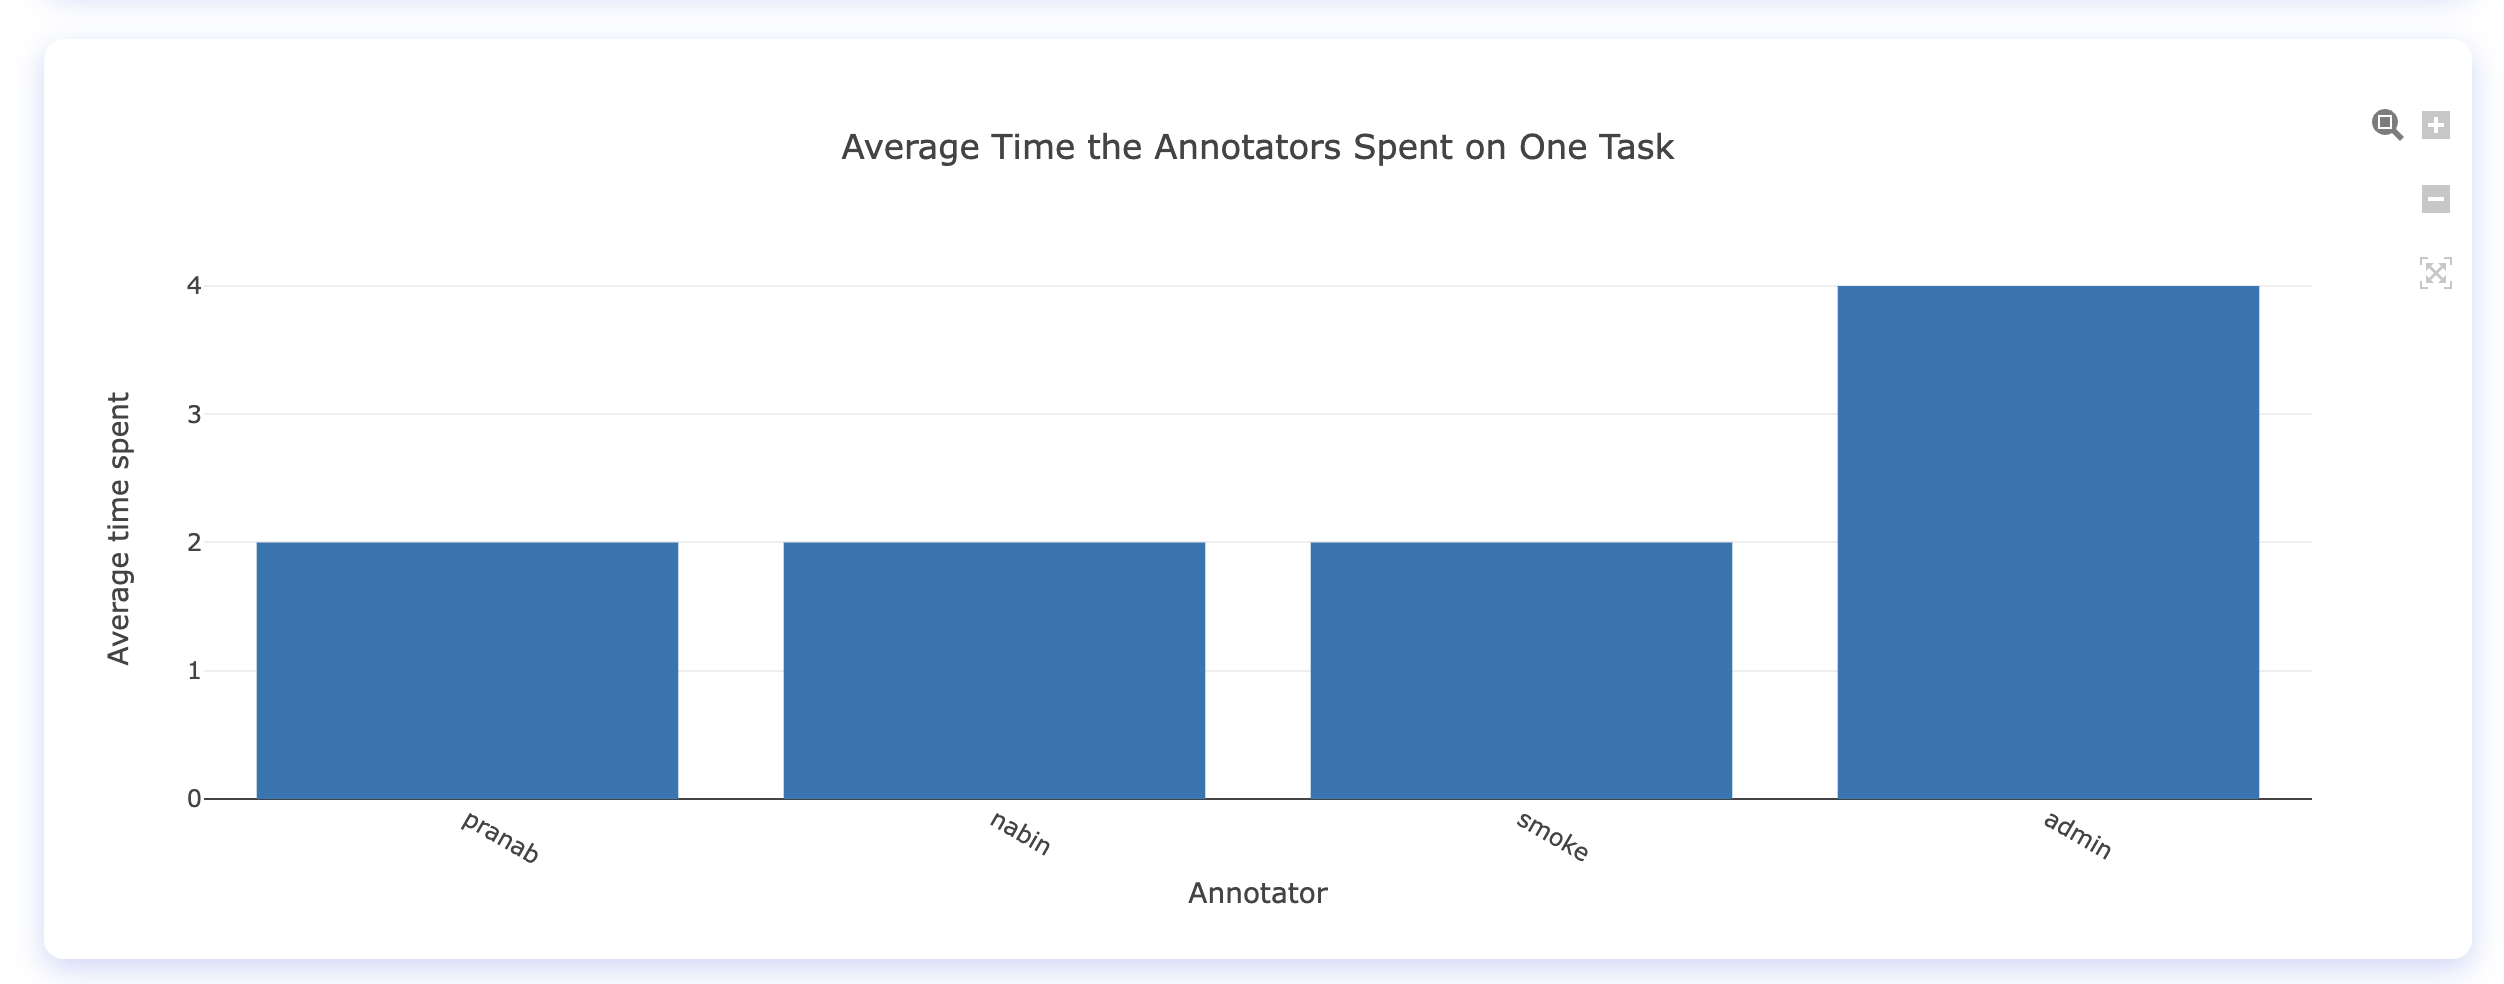
In previous versions, some users reported inconsistencies in the Average Time Annotator Spend on One Task chart. Specifically, some bars in the chart represented the same value for the amount of time annotators spent on a single task but differed in height. This issue has been resolved in version 4.9. The chart now accurately displays the same value for the amount of time annotators spend on a single task with consistent bar height. Overall, this update represents our ongoing commitment to improving the functionality and user experience of the NLP Lab platform, ensuring that users can trust the accuracy and consistency of the data they rely on for their projects.
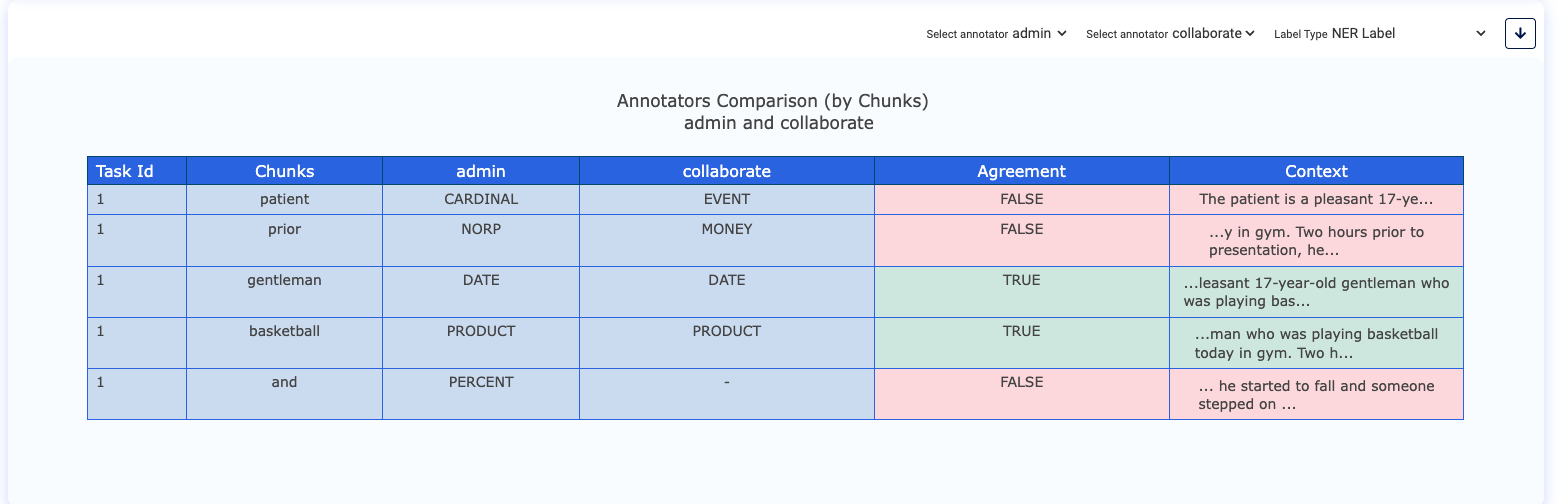
Another new feature added to the “Annotators Comparison (by chunks)” chart is a column titled “Context” that provides users with additional information about each chunk of data being annotated. The Context column displays 50 characters before and after each chunk in the task content, allowing users to view the context in which the chunk appears. This additional information helps users check the consistency of annotations across team members by making it easier to understand the correctness of annotations and to identify the errors in the data. Overall, this update represents an important improvement in supporting the IAA processes, specifically in making informed decisions about how to annotate each chunk of data.
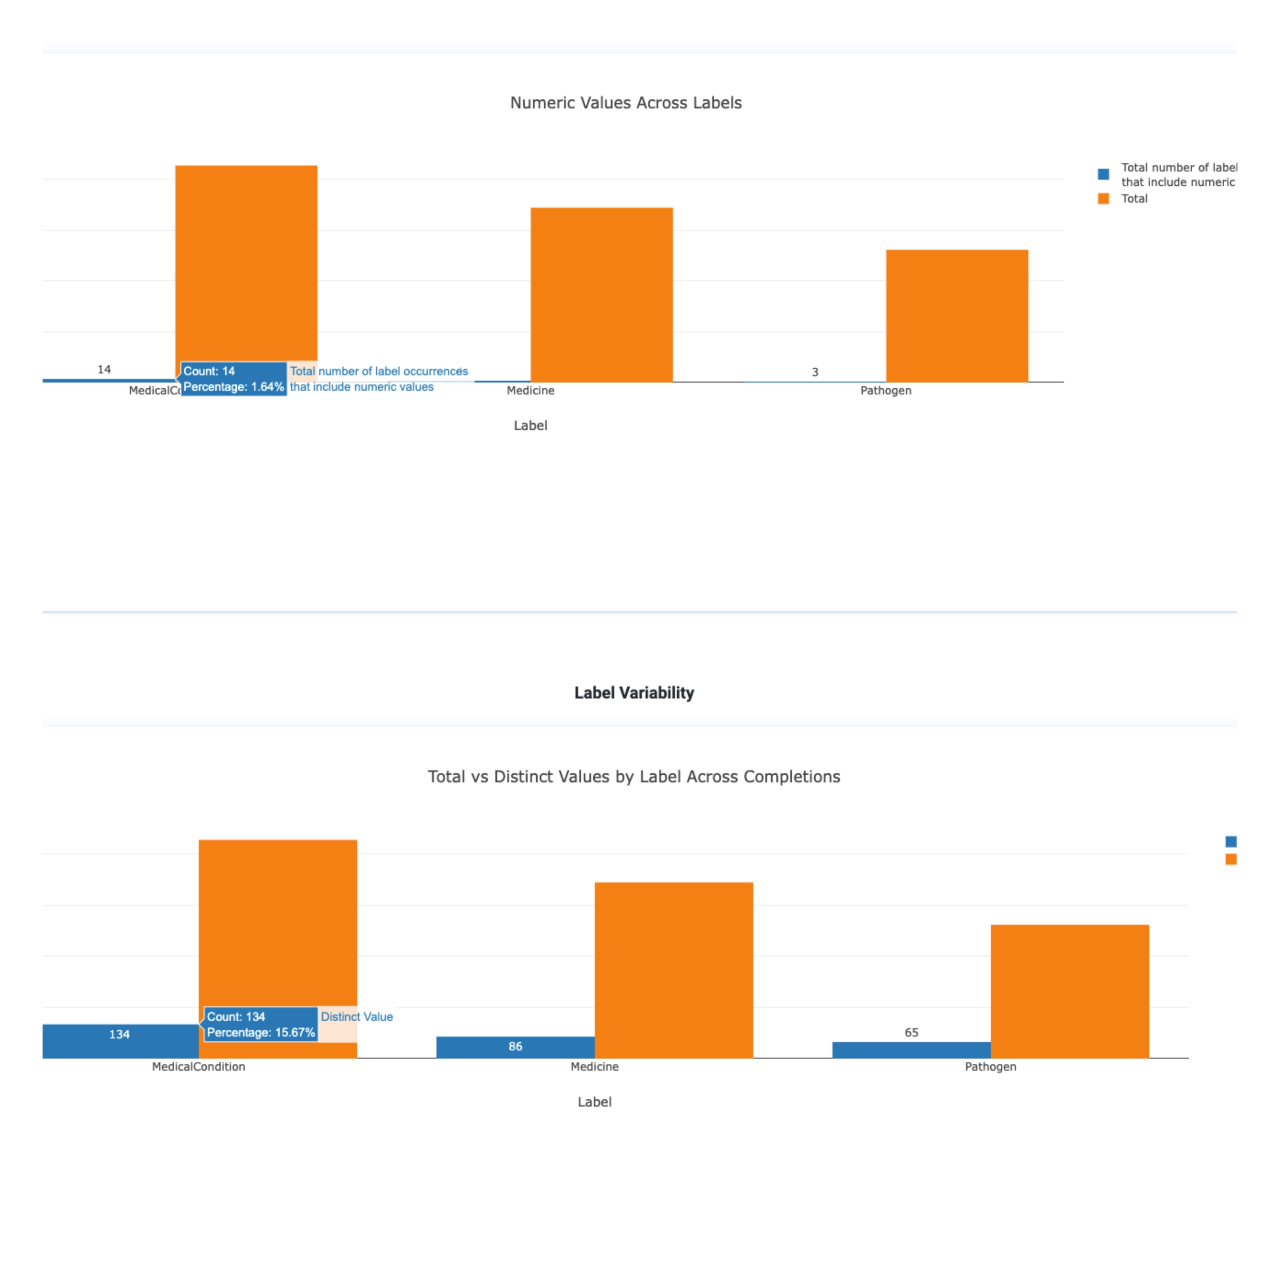
Two bar charts have also been updated “Total vs distinct values by label across completions” and “Numeric values across labels”. Previously, these charts displayed percentages and now they display the label counts instead. By providing users with the Label count, users can more easily understand the distribution of labels across completions and numeric values across labels. This change can help users make more informed decisions about how to annotate data, resulting in improved accuracy and consistency in their annotations.
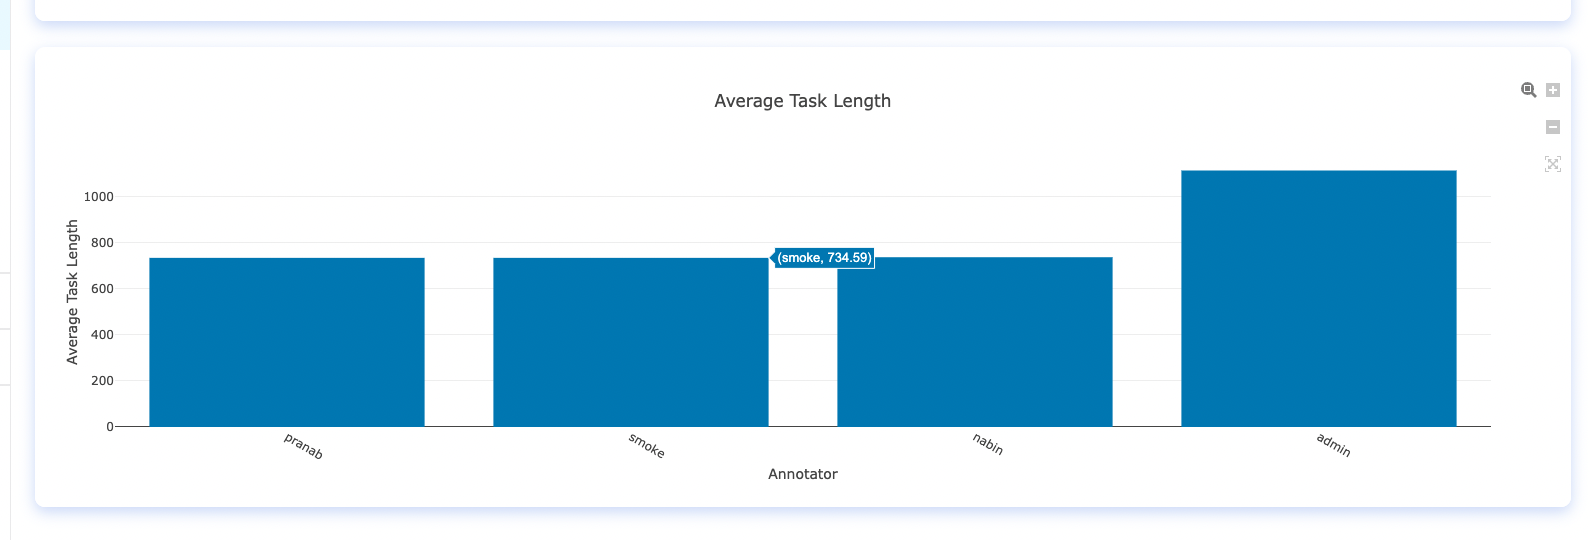
A new bar chart was also added to the Tasks tab of the Analytics page, called “Average Task Length”. It displays the average length of tasks completed by each annotator, measured in the number of characters. The chart is calculated based on the total number of tasks assigned to a user that contain at least one completion created by the respective user, regardless of the status of the task. This chart provides valuable insights into the performance of annotators, allowing them to compare each other’s productivity patterns and trends related to task length. By understanding how long each task is on average, users can make more informed decisions about how to allocate resources and manage their projects effectively.
Improvements
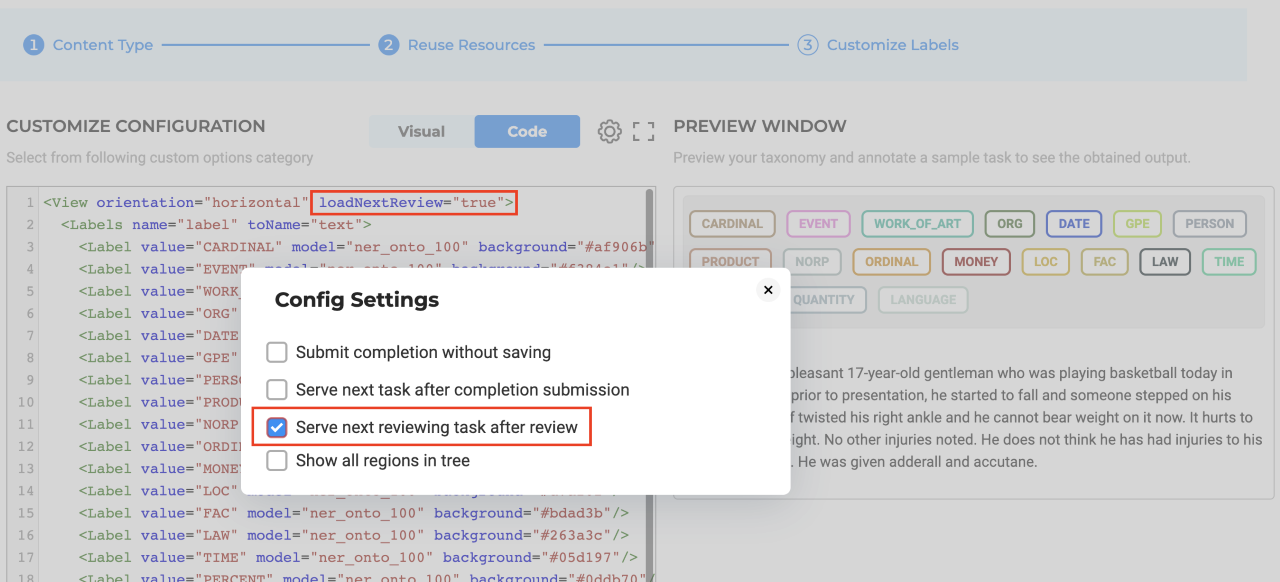
Serve the Next Task in Line for Reviewers
After a reviewer completes a task review, the system will automatically serve the next task to the reviewer, saving time and streamlining the process. This feature can be enabled through the configuration page by checking the “Serve next reviewing task after review” option. With this feature, reviewers can continue working without the need to manually request the next task. This can help ensure that the review process is always moving forward and that reviewers have a continuous stream of work.
License ID Available on License Page
A recent update to the system has introduced enhancements to the license import process. Specifically, users can now view a License ID for each license on the “Existing Licenses” page, which is also included in the “popup” used for importing licenses. It is worth noting that the option to log in via MyJSL has been removed from the “Existing Licenses” tab and is only accessible on the Import License page. However, it is important to bear in mind that manually imported licenses will not display a License ID. These changes are intended to facilitate the recognition of licenses and improve the user-friendliness of the license page.
Improved Task Status Indicators for Pre-Annotation Results
In the current system, a red circle is displayed when pre-annotation fails to produce results for a task. However, this can be misleading as it implies an error has occurred. To rectify this, we replaced the red circle with a gray circle for tasks that yield zero pre-annotation results. This modification aims to provide users with a more precise representation of the pre-annotation process, clarifying that no errors have taken place.
Improved Task Status Indicators for Pre-Annotation ResultsOptimezed Layout for Expanded Annotation Page
The recent update enables a better use of empty spaces in the annotation area when it is expanded. To increase the annotating area, the sidebars are now hidden, and the top title area is also hidden to provide the maximum area for annotators to work on.
Improved Layout for Side Bar Tabs
In the previous versions, when the “move side panel to the bottom” option was enabled, the sidebar was relocated to the bottom of the screen but with the same layout. The layout in this mode has been modified to utilize the entire horizontal space. This was accomplished by dividing the sidebar tabs into distinct widgets, eliminating the need for users to switch between tabs.
Display of License Expiration Warnings
If a license has less than 30 days of validity remaining but other licenses have more than 30 days, no warning banner will be shown. On the other hand, if all licenses are about to expire, with a validity of less than 30 days, a warning banner will be displayed indicating the expiration date. The purpose of this feature is to provide clear and timely information to users regarding the status of their licenses.
Dia Trambitas is an AI Product Manager with deep expertise in Natural Language Processing and applied Generative AI. At John Snow Labs, Dia has led the development of the Generative AI Lab — a no-code platform for data annotation and model training — as well as the Medical Chatbot, a secure and domain-specific conversational AI assistant tailored for clinical environments. With a strong focus on practical deployments of cutting-edge AI, she has worked at the intersection of healthcare and technology, driving product innovation that empowers users to harness large language models safely and effectively. Passionate about transforming unstructured data into actionable insights, Dia brings a strategic and user-centered approach to building AI tools that are both powerful and accessible.


 width=”1629″ height=”573″ />


 width=”1629″ height=”573″ />