


Every healthcare AI team eventually faces the same uncomfortable question: Can you prove who accessed what, when, and why?
Most can’t. Not cleanly. Not instantly. Not in the way a compliance officer or an auditor actually needs.
That changes with Generative AI Lab 7.8.
The compliance problem that quietly grows
Healthcare AI teams move fast. Projects get created, data gets exported, and models get tested. And somewhere in that velocity, the audit trail gets thin.
It’s not negligence. It’s architecture. Most annotation platforms weren’t designed with PHI traceability in mind. They were designed for speed, not accountability.
But in regulated environments — hospitals, payers, pharma, life sciences — “we think it was fine” is not an acceptable answer when someone asks about data access.
What we built: The audit logs dashboard
Generative AI Lab 7.8 introduces a HIPAA-compliant Audit Logs Dashboard — a centralized, real-time system that logs every meaningful platform event: user actions, data access, exports, project lifecycle changes, and API calls. Every entry is timestamped and tied to a specific user.
It’s organized into purpose-built views so you’re never digging through raw logs.
Project Lifecycle Dashboard — see every project created or deleted, every export at the project and task level, with full timestamps and user attribution. When a spike in deletions happens at 11pm on a Friday, you’ll know exactly who did what and when.
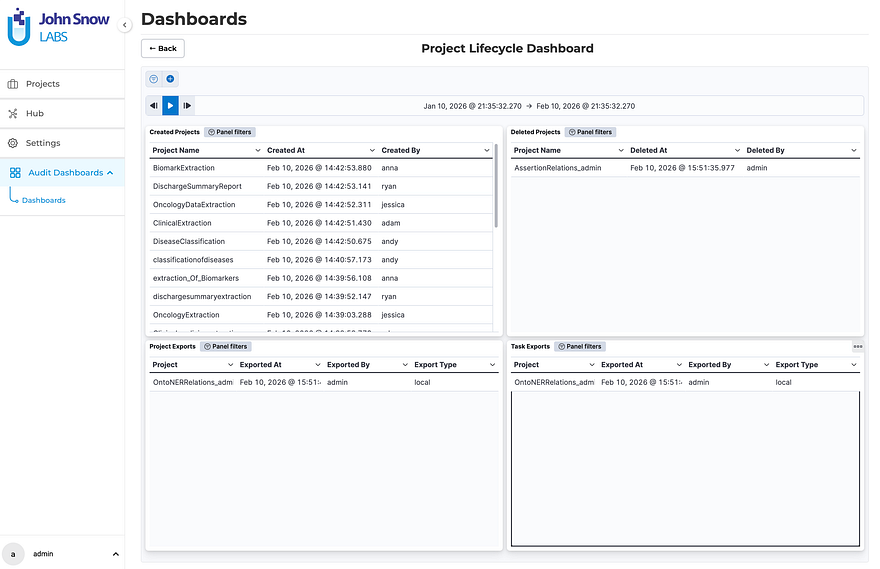
The Project Lifecycle Dashboard displays created and deleted projects alongside project-level and task-level export history, each with timestamps and user attribution.
User Behavior & Access Dashboard — ranks users by request volume, surfaces hourly and daily usage patterns, and shows per-project activity over time. This isn’t just compliance theater. It’s actually useful for capacity planning, anomaly detection, and resource optimization.
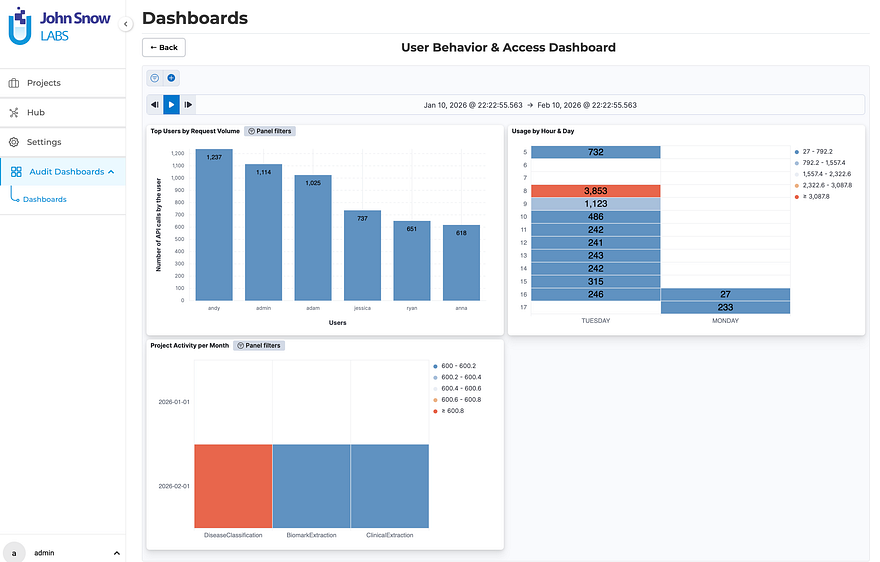
The User Behavior & Access Dashboard surfaces request volume per user, platform usage heatmaps by hour and day, and monthly project activity breakdowns.
API & System Monitoring — captures API usage trends, HTTP response codes, and platform-wide usage heatmaps. When something breaks or behaves unexpectedly, you have a forensic baseline.
Real use case: A compliance officer investigates a spike in project deletions. She filters by date range, sees exactly which user triggered each deletion, checks whether exports preceded the deletions, and confirms in minutes whether the behavior was expected or anomalous. No ticket to IT. No waiting.
The backend runs on Elasticsearch, provisioned automatically. Enabling it takes one flag at install or upgrade time:
./annotationlab-installer.sh --enable-audit-logs
That’s it. No workflow changes for your annotation teams. No reconfiguration of existing projects. It just starts working.
Three more improvements worth knowing
1. Pipelines Finally Know Which Project They Belong To
This one sounds small. It isn’t. If you’ve ever accidentally pre-annotated an NER project with a Visual NER pipeline, you know the confusion it causes. Servers and pipelines now only appear in the pre-annotation modal for the project type they were deployed in. NER sees NER resources. Visual NER sees Visual NER resources. Full stop.
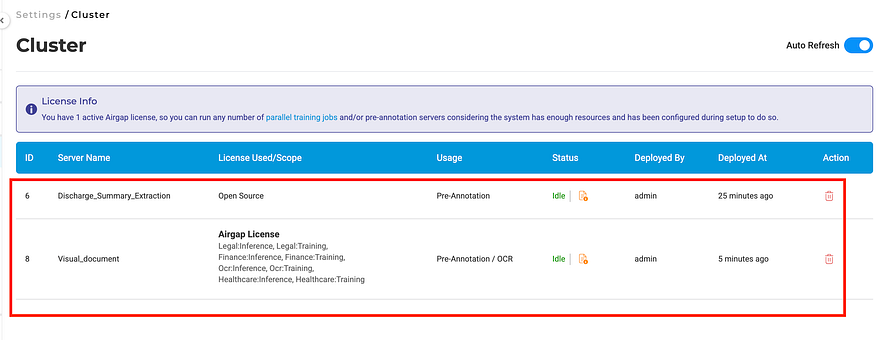
The Cluster page lists all deployed pre-annotation servers.
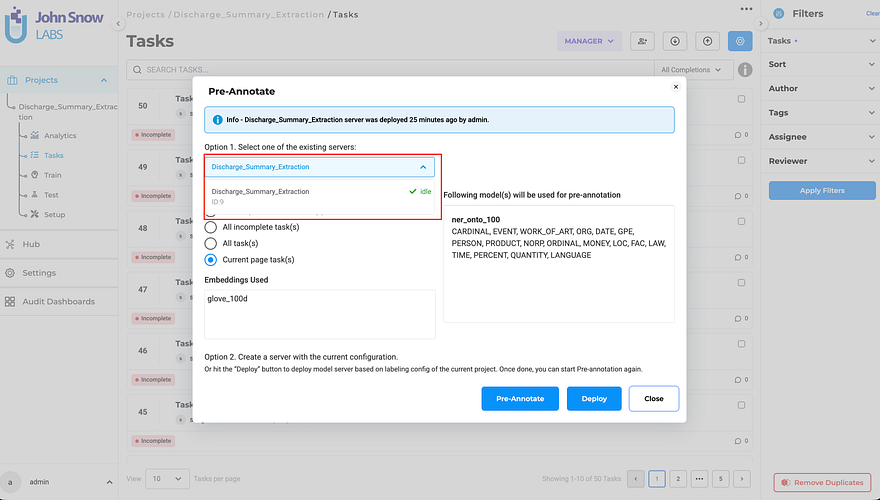
The Pre-Annotate dialog now shows only compatible pipelines — no more accidental cross-type selections.
2. Deployment No Longer Disappears into a Black Hole
Clicking Deploy used to close the dialog immediately — leaving users guessing whether the server was still spinning up or already ready. The modal now stays open and shows real-time status. Close it early? The Pre-Annotate button shows a loading indicator. Comes back to life automatically when the server is ready.
The pre-annotation pop-up stays open during initialization, giving you continuous deployment progress feedback.
3. The Playground Tells You What Actually Happened
After running a pre-annotation test, you now get an explicit outcome notification. Green means it worked and produced results. Orange means it ran successfully but found no matches — which is very different from failing. Red means something went wrong.
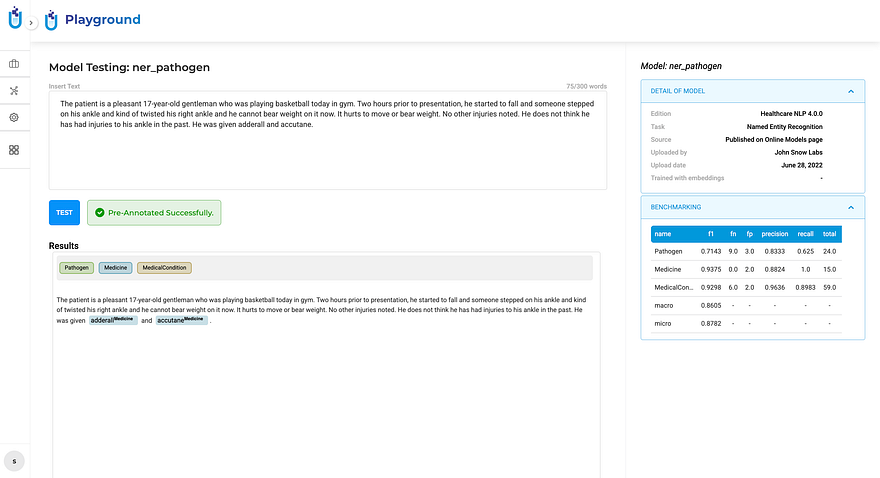
Green: pre-annotation completed and generated results.
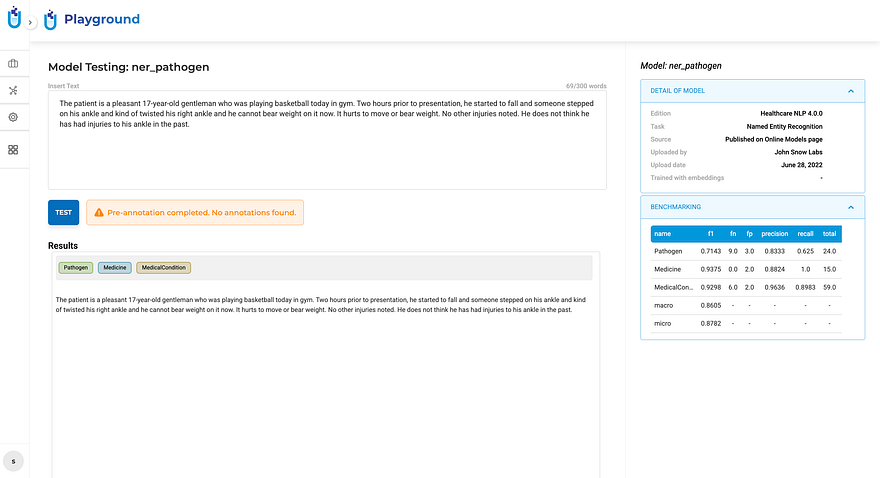
Orange: the run succeeded, but produced no annotations for this input — not a failure, but worth knowing.
This distinction matters more than it sounds. Teams were routinely second-guessing successful runs with zero matches, assuming the model had failed. Now they know.
And a few smaller wins that add up
Click-to-Navigate Comments — clicking a comment now scrolls directly to the exact location in the document where it was placed, with the referenced content highlighted. In long documents with multiple reviewers, this alone saves a surprising amount of time.
Click a comment, land exactly where it was placed. No more manual scrolling to find context.
Visual NER Scrollbars — large and high-resolution documents in the Visual NER viewer can now be navigated with standard horizontal and vertical scrollbars, not just drag-to-reposition.
The Visual NER viewer now supports native scrolling in both directions for large documents.
Updated Zoom & Pan Controls — the toolbar in Visual Projects now has clearer, more discoverable zoom and pan buttons for working with PDFs and image documents.
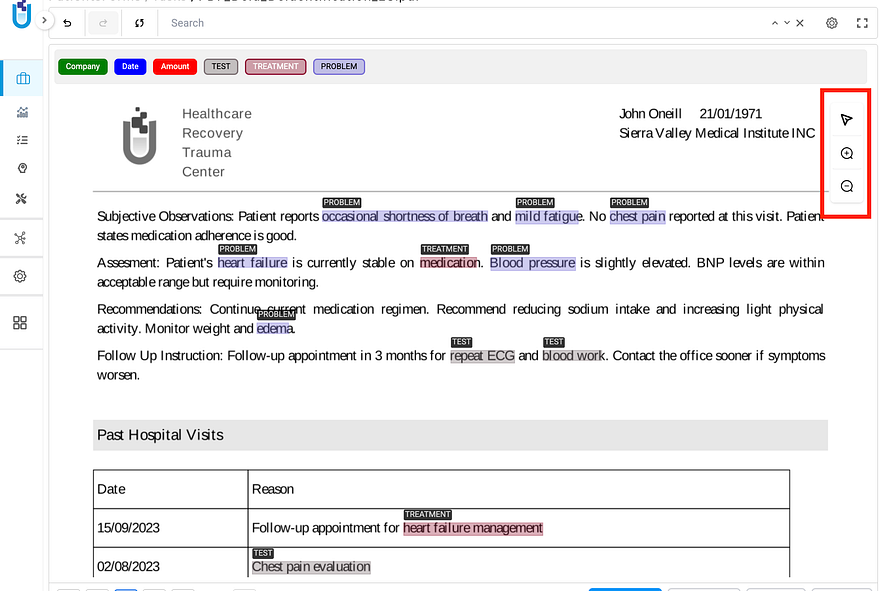
Cleaner zoom in, zoom out, and pan controls — easier to find, easier to use.
Responsive Analytics Charts — charts now render correctly on smaller screens and laptops without overlapping labels or broken legends.
Chart elements now adapt dynamically to smaller viewports — no more squinting or manual zoom.
Why this release matters beyond the feature list
Healthcare AI is maturing. The early days of “let’s get models working” are giving way to “let’s prove they’re working correctly, securely, and in compliance.” Audit logging isn’t a nice-to-have for regulated environments — it’s a prerequisite for production deployment at scale.
What 7.8 does is remove one of the last friction points between annotation platforms and enterprise compliance requirements. You don’t have to build logging infrastructure on top of your annotation layer. You don’t have to integrate a third-party audit tool. You don’t have to write custom scripts to reconstruct who did what.
It’s built in, configurable, and designed for the environments where it actually matters.
How to get started
Full release notes: Generative AI Lab 7.8 Documentation
“HOW TO” Generative AI Lab video course on YouTube
Schedule a demo tailored to your compliance and annotation workflow.