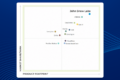


Although both Python and R are taking the lead as the best data science tools, we can still find a lot of blogs and articles discussing the eternal question “Python or R for data science”. Most blogs end with a bottom-line conclusion that both languages are winners. It depends on which problem you want to solve and what is the most important feature you need most in your project or work.
When it comes to data visualization, the matter is a bit different. Most opinions tend to prefer Python. Data visualization with Python is much easier and the output is less complicated and easier to understand.Python endorses many libraries that can add advanced features to your charts. Matplotlib, Seaborn, Folium, and Bokeh are the most commonly used libraries for data visualization in Python. As the choice between Python and R depends on the problem you want to solve and the features you need, the choice between Python libraries and which one to use depends on which type of data you are dealing with. Geospatial data (Geo data) is somewhat different from other datasets.
Understanding Folium
Learn and try Folium library as if you are manufacturing a car. Car manufacturers first build the skeleton (body) of the car, painting it and finally add the wheels and other accessories. While understanding and trying Folium it is better to follow the same methodology; learn how to build the chart in its simplest form and then dive deeper to learn how to add some advanced features.
Most traditional data visualization tools like bar charts, area blots can be done by importing Matplotlib and Pandas together.
With Folium, you can plot advanced charts like heatmaps, time analysis and choropleth maps. With one line of code, you can obtain the world map or a country map (if you know its latitude and longitude). This blog can be considered as a primer to Folium library. Advanced features of the library will be discussed in coming blogs.
You can use different tools to write your Python code (you can use PyCharm, Jupyter Notebook or your favorite integrated development environment (IDE)). Jupyter Notebook will be much easier for newcomers.
Installing Folium Library and Importing it
After downloading the data, try to install Folium library, so you can import it in your code.
Run The following command outside the IPython Shell, you can run it in the command line interpreter (cmd):
pip install folium
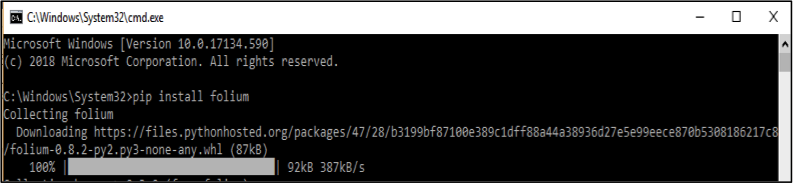
Figure 1: Successful Installation of Folium Library
The world map by a single line of code
Now, try to draw your first world map with Folium. It may be easier for you than a “Hello World”-program in C Language.
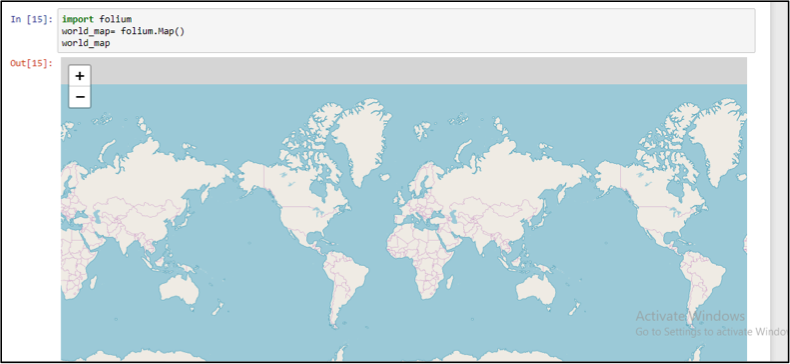
Figure 2: Output of Drawing the world map with Folium
Showing the country names
The previous map in Figure 2 shows only the country borders without showing the names of the countries. If we want to show the country names, just addtiles = ‘Mapbox Bright’to your code as follows:
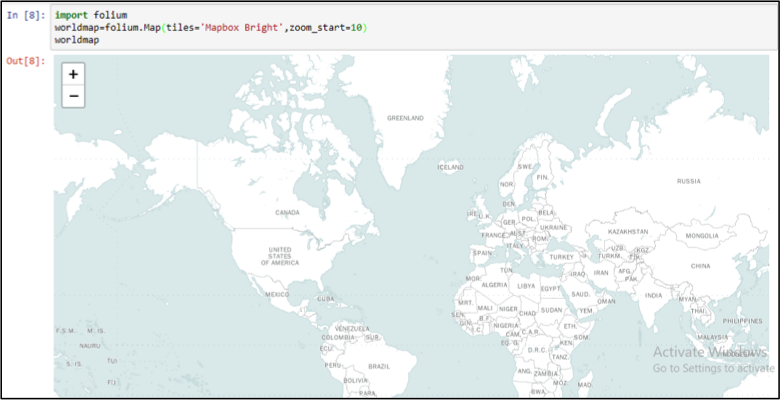
Figure 3: Output of Drawing the world map (with country names) with Folium
The world map by a single line of code
Make it a bit harder and move to the next level. Try to plot a map for London. In this case, you must determine the latitude and longitude.
		import folium
		london_location = [51.507351, -0.127758]
		london_city = folium.Map(location=london_location, zoom_start=16)
		london_city

Figure 4: Output of Drawing London map with Folium
Different Map Styles
Your map can have different styles with Folium depending on your needs. Here is an overview of different styles you can obtain with Folium and how you can obtain them through a few lines of code:
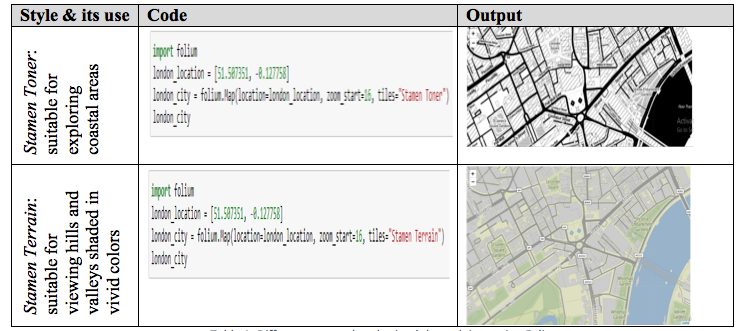
Table 1: Different map styles obtained through importing Folium
Adding Markers
Adding markers to the map is a bit more complex. It just takes you a few more steps:
First, create a “feature group”. The default for a feature group to be empty when initially created. You have then to add “children” to the empty feature group. This child is the mark we want to superimpose on our map. This mark can have various colors and various shapes (e.g.: circular or cross). The specific position on the mark on the map is determined latitude and longitude values.
Try to add a circular mark in the middle of London map by applying the following code:
		import folium
		london_location = [51.507351, -0.127758]
		london_city = folium.Map(location=london_location, zoom_start=16)
		london=folium.map.FeatureGroup()
		london.add_child(folium.CircleMarker([51.507351, -0.127758], radius = 30, color = "blue", fill_color= "Red"))
		london_city.add_child(london)
		#Adding an interactive clickable marker
		folium.Marker([51.507351, -0.127758], popup="London Center").add_to(london_city)
		london_city
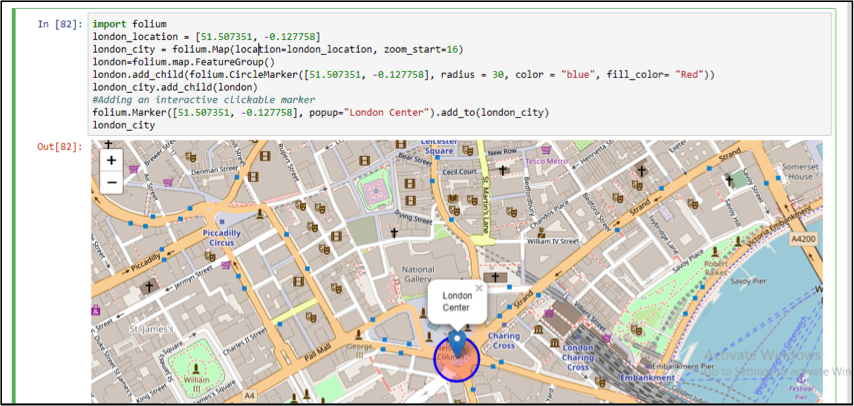
Figure 5: Adding Markers using Folium
Playing with Folium
In most of the Folium applications, you will need the coordinates of the area or country or interest.John Snow Labs repository contains a free dataset including all countries latitude and longitude.
You can download the free sample found on the page as you will not need too much data to try. If you have extensive work or need extensive training with geospatial data, you have to subscribe for the complete Geography Data Package.
Folium’s powerful visualization capabilities enable users to explore complex data sets effectively, transforming how insights are communicated and understood. By integrating tools like Generative AI in Healthcare and implementing a Healthcare Chatbot, organizations can further enhance data accessibility, improve decision-making processes, and facilitate better patient interactions.