


In a situation like the one the world is experiencing now, where there is an epidemic or a pandemic, we must know the indications and actual meanings of the medical terminologies and indicators you read in the news and different published reports.
Unfortunately, many data scientists work in the healthcare field lacks the healthcare domain experience. Hence, for the sake of the unprofessional reader and data scientists with no healthcare background, this blog and the next one will introduce a brief about the basic concepts of public health, biostatistics, and epidemiology with a focus on measuring the occurrence of diseases.
When you read the news and reports about the COVID-19 outbreak, you need to know the difference between the definitions of epidemic and pandemic, the prevalence and incidence, and mortality and morbidity.
Epidemiologic data reveal the prevalence of the disease, its variation by season, its geographic location, and how it is influenced by certain risk factors.
Understanding epidemiological problems and data can allow physicians to make the diagnosis and develop management plans for patients. It also helps to make decisions about the best use of health resources. Physicians are continually forced to evaluate information about drugs and medical equipment. Such information is usually provided by companies’ representatives (Medical Representatives). They use study results, graphs, and charts to show that their products are better than others on the market.
Physicians must know how sensitive a diagnostic test is in detecting the disease and how often the test correctly indicates no disease in a healthy person (Sensitivity and Specificity).
Vital Indices
They can be classified into three categories: (Morbidity indicators, Mortality indicators, and Fertility indicators). This blog will focus on Morbidity indicators.
Morbidity indicators
Measures disease frequency and contain two measures:
1. Prevalence
The number of people in a population who have a disease or health-related condition at a given point in time or a certain time period.
Therefore, Prevalence measures the existence of the disease or the amount of disease present in a population.
Simply, this means: Prevalent Cases = All cases [new + old]
Types of Prevalence:
- Point Prevalence:
It is based on a single examination, at one point in time, and aims to underestimate the condition’s total frequency.
- Period Prevalence:
It is a better measure of prevalence as it is defined as the proportion of a population that are cases at any time within a stated period.
Uses of Prevalence:
As it is a snapshot of disease or health event, it can help in:
- Estimates the magnitude of health problems.
- Help health care providers plan to deliver services [need for treatment/hospital beds].
- Indicate groups of people who should be targeted for control measures (high-risk groups).
2. Incidence
The rate at which people without a disease develop the disease during a specific time. It is an indication of the number of new cases of disease occurring over a specified time in a population at risk at the beginning of the interval.
Incidence Rate:
The rate at which people without a disease develop the disease during a specific time. In other words, it is the number of new cases of disease occurring over a specified period in a population at risk at the beginning of the interval.
Attack Rate:
The incidence of the disease is called “Attack Rate” when:
- The duration of the disease is short (Acute infectious disease e.g. Food poisoning).
- When a disease is frequent (Recurrent infectious disease e.g. diarrhea).
- The observation period covers an entire epidemic/outbreak.
Uses of Incidence:
As it estimates the risk (probability) of developing an illness. So, it can measure the change from “healthy” status to illness. Moreover, it can help in evaluating prevention programs or forecasting the need for services and health programs.
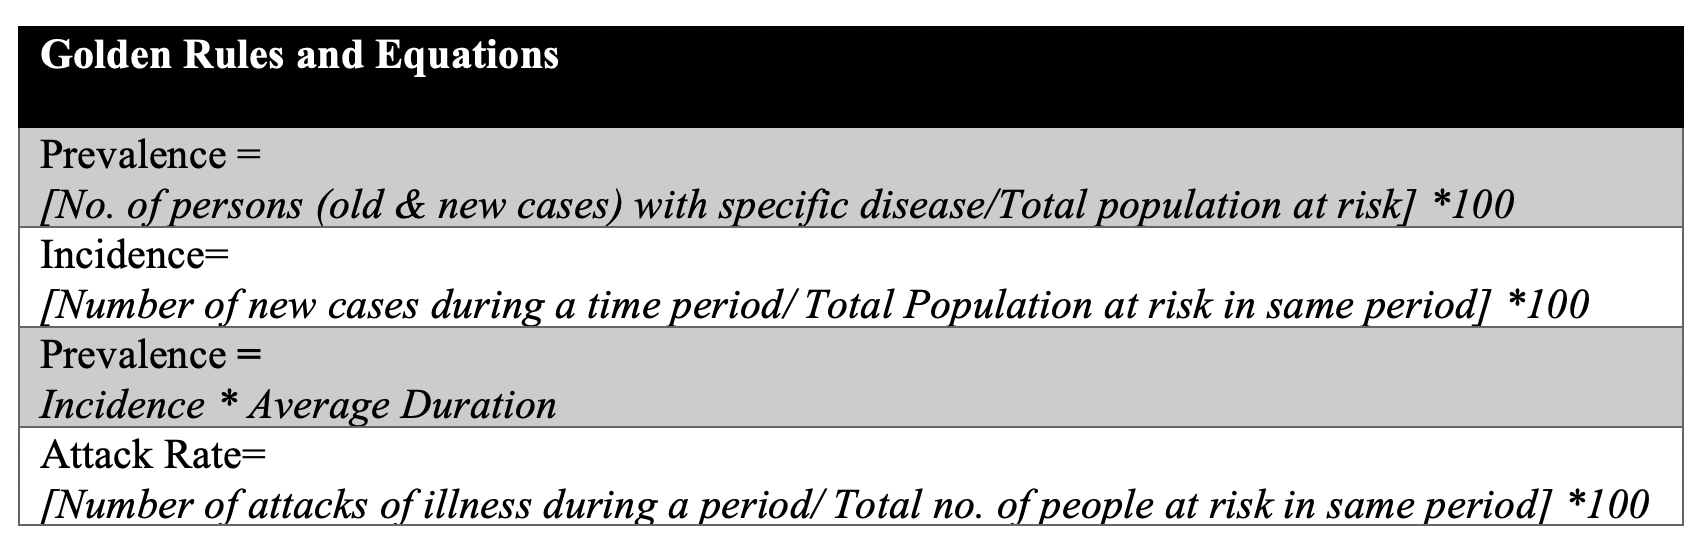
The following table summarizes all the rules and equations used to calculate incidence, prevalence, and attack rate:
Many data scientists realized earlier the importance of tracking and keeping records of incidence and prevalence rates for specific diseases. Some healthcare big data repositories keep unique and important datasets for incidence and prevalence for specific diseases.
John Snow labs catalog has very previous datasets for HIV incidence, prevalence, and mortality, global smoking prevalence, and prevalence of pneumoconiosis in a cohort of coal miners.
There are many other interesting datasets that can show the importance of tracking incidence and prevalence. Besides, the reader can download a free sample from the dataset.
As healthcare continues to evolve, Generative AI in Healthcare is transforming the way we analyze and interpret disease data, while innovations like the Healthcare Chatbot are enhancing patient engagement and empowering healthcare professionals to deliver more precise care based on these insights.