


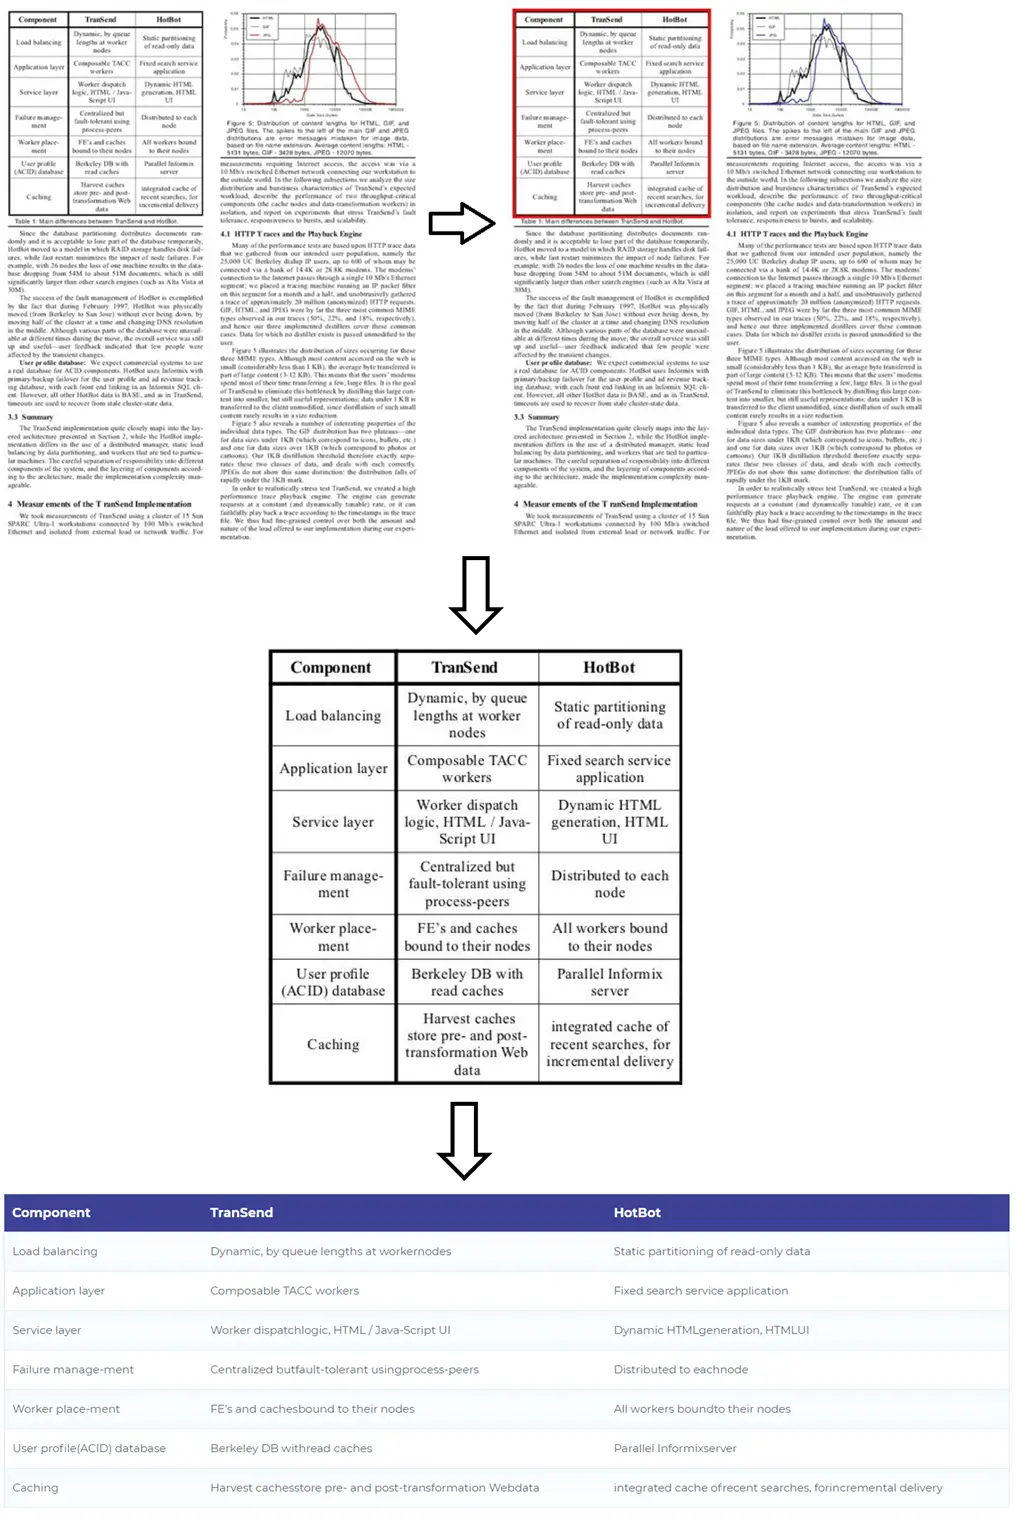
Introduction to Table Extraction
The amount of data collected is increasing every day with many applications, tools, and online platforms booming in the current digital age. To make sense of, manage, and access this enormous data quickly and productively, it’s necessary to use effective information extraction tools. One of the sub-areas that’s demanding attention in the Information Extraction field is the detection and automatic extraction of data from tabular forms.
Table Extraction means effectly and quickly detect and decompose table information in a document.
If you have lots of paper files and documents that contain tables and you would like to extract the corresponding data, you could copy them manually (onto paper) or load them into excel sheets. However, with the new Spark OCR table extraction feature, you can send tables as pictures to the computer which will extract all the information and automatically generate a new structured document in a simple to use format (CSV file, JSON file, data frame, etc.). This can save a great amount of time and minimize the number of errors often associated with manual data processing.
For organizations, this is a huge benefit because tables are frequently used to represent data in a clean format. There are many organizations that have to deal with millions of tables every day. To save time and automate these laborious manual tasks, faster and more precise tools are needed such as Spark OCR, which can quickly extract tabular data from PDF.
PDF is very useful to format for storing medical and financial documentation. Most of these documents contain tables and we need to extract data from them for business needs. Another intro post related to this subject is available here: Table Detection & Extraction in Spark OCR, and covers the basics steps for extracting tabular data from the PDF.
Spark OCR can work with generated (searchable) and scanned (image) PDF files.
1. Start Spark session with Spark OCR
import os
        from sparkocr import start

        os.environ["AWS_ACCESS_KEY_ID"] = AWS_ACCESS_KEY_ID
        os.environ["AWS_SECRET_ACCESS_KEY"] = AWS_SECRET_ACCESS_KEY
        os.environ['JSL_OCR_LICENSE'] = "license"

        spark = start(secret=secret, nlp_version="3.1.1")
During the start Spark session start function displays the following info:
Spark version: 3.0.2
Spark NLP version: 3.0.1
Spark OCR version: 3.5.0
In order to run the code, you will need a valid Spark OCR license. You can get a 30-days free trial here.
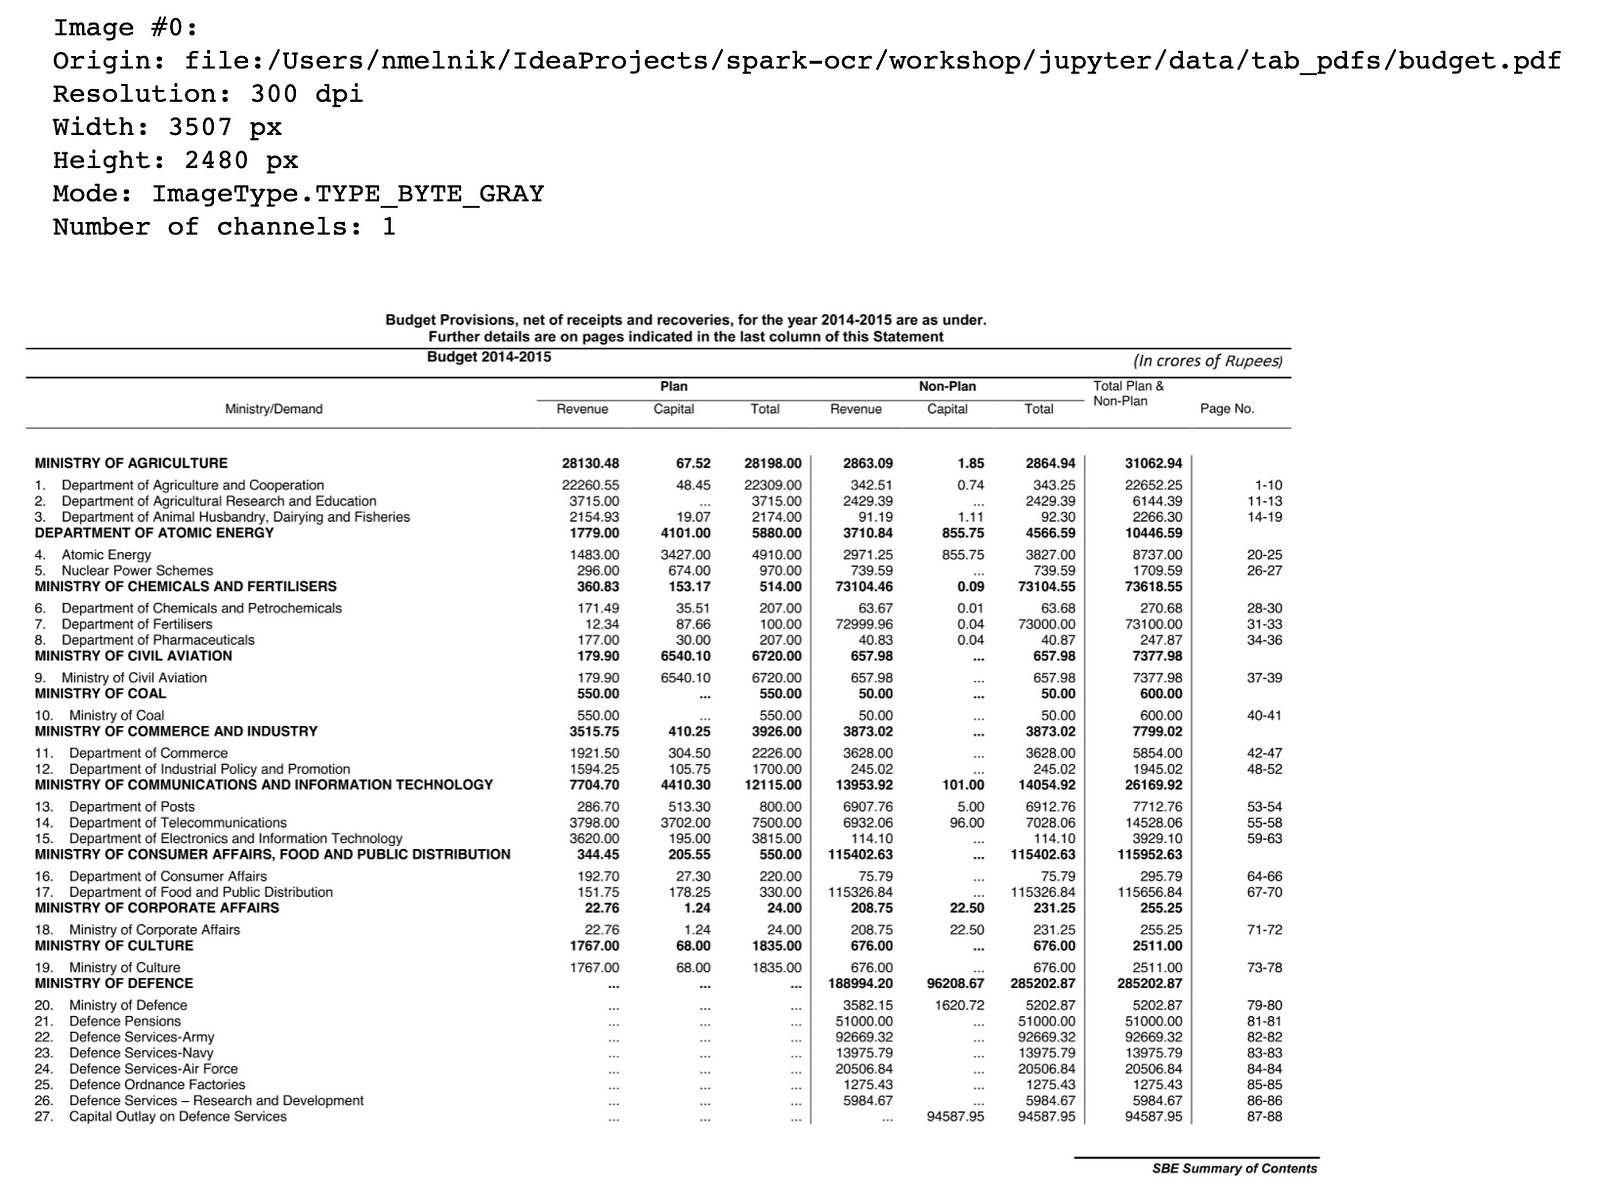
2. Read PDF document
The following example illustrated the processing of a PDF file which includes a Budget Provisions table. Let’s read it as binaryFile to the data frame and display content using display_pdf util function:
from sparkocr.transformers import *
    from sparkocr.utils display_pdf
    pdf_df = spark.read.format("binaryFile").load(pdf_path)
    display_pdf(pdf_df)
3. Define Spark OCR Pipeline
To convert each page of a PDF document to an image we can use PdfToImage transformer. It is designed for processing small and big pdfs (up to a few thousand pages). It supports the following features:
- Splitting big documents into small pdfs for effectively using cluster resources when processing big documents. So we can distribute the processing of one big document to all cluster nodes if needed. It supports several splitting strategies: SplittingStrategy.FIXED_NUMBER_OF_PARTITIONS and SplittingStrategy.FIXED_SIZE_OF_PARTITION.
- Repartition data frame after splitting to avoid skew in the data frame. This prevents the situation when one task of the job has significantly higher processing time. So resources can be utilized more effectively.
- Binarization of the images as soon as possible to reduce memory usage and speed up processing.
- Repartition data frame after extracting image for each page. This additionally prevents skew in the data frame.
The pipeline for table detection and extraction is the following:
# Convert pdf to image
        pdf_to_image = PdfToImage()

        # Detect tables on the page using pretrained model
        # It can be finetuned for have more accurate results for more specific documents
        table_detector = ImageTableDetector.pretrained("general_model_table_detection_v2", "en", "clinical/ocr")
        table_detector.setInputCol("image")
        table_detector.setOutputCol("region")

        # Draw detected region's with table to the page
        draw_regions = ImageDrawRegions()
        draw_regions.setInputCol("image")
        draw_regions.setInputRegionsCol("region")
        draw_regions.setOutputCol("image_with_regions")

        # Extract table regions to separate images
        splitter = ImageSplitRegions()
        splitter.setInputCol("image")
        splitter.setInputRegionsCol("region")
        splitter.setOutputCol("table_image")
        splitter.setDropCols("image")

        # Detect cells on the table image
        cell_detector = ImageTableCellDetector()
        cell_detector.setInputCol("table_image")
        cell_detector.setOutputCol("cells")
        cell_detector.setAlgoType(CellDetectionAlgos.MORPHOPS)

        # Extract text from the detected cells
        table_recognition = ImageCellsToTextTable()
        table_recognition.setInputCol("table_image")
        table_recognition.setCellsCol('cells')
        table_recognition.setMargin(3)
        table_recognition.setStrip(True)
        table_recognition.setOutputCol('table')

        pipeline = PipelineModel(stages=[
            pdf_to_image,
            table_detector,
            draw_regions,
            splitter,
            cell_detector,
            table_recognition
        ])
ImageTableCellsDetector detects cells and supports several algorithms:
- CellDetectionAlgos.MORPHOPS can work with bordered, borderless tables and combined tables.
- CellDetectionAlgos.CONTOURS can work only with bordered tables but provides more accurate results.
More details about Table Detection & Extraction pipeline please read here.
4. Run pipeline and show results
Let’s run our pipeline and show the detected table on the page:
results = pipeline.transform(pdf_df).cache()
        from sparkocr.utils import display_images_horizontal
        display_images_horizontal(results, "image, image_with_regions", limit=10)
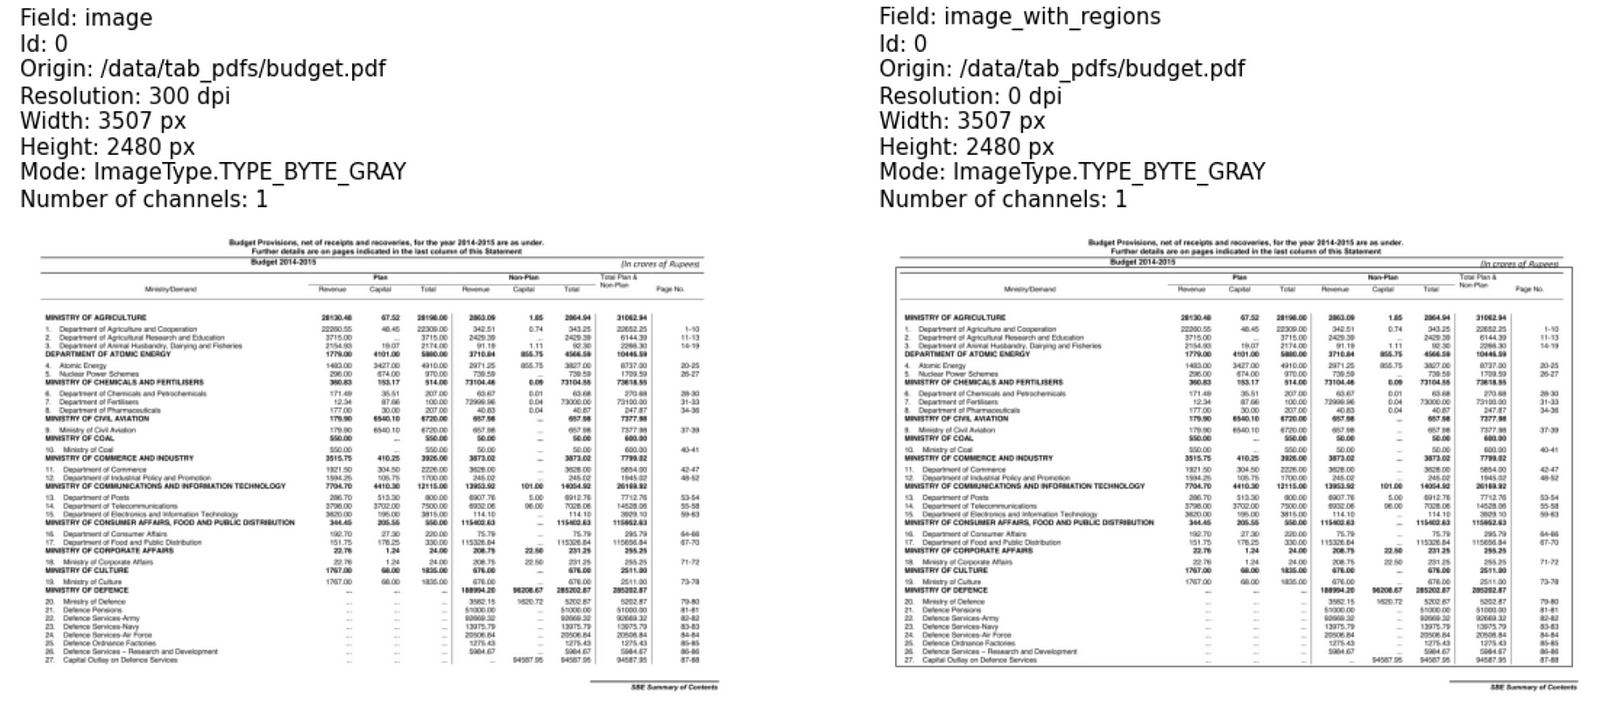
Table coordinates with probability score we can obtain from the region field:
results.select("region").show(10, False)
        +-------------------------------------------------+
        |region                                           |
        +-------------------------------------------------+
        |[0, 0, 83.0, 260.0, 3308.0, 1953.0, 0.9999957, 0]|
        +-------------------------------------------------+
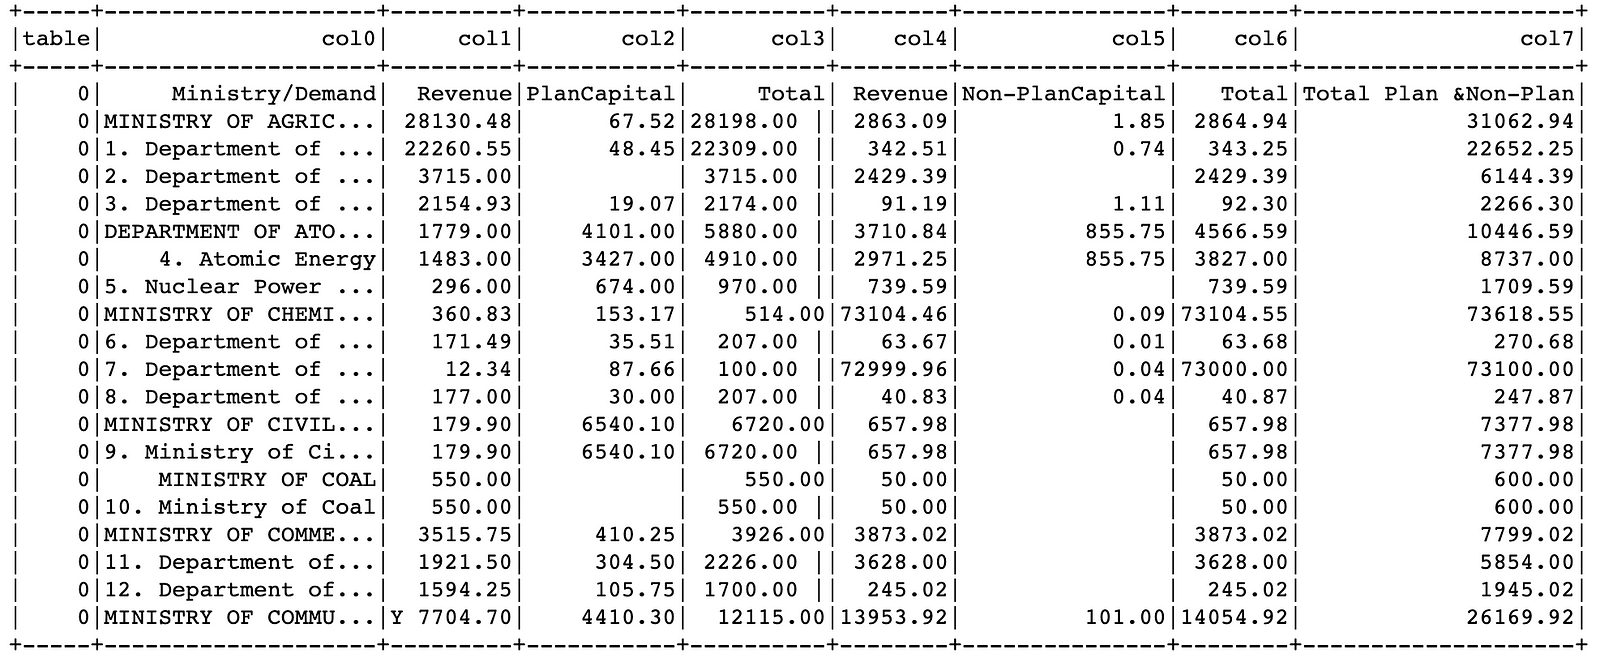
And as the final step we can show the detected structured data from the table field:
exploded_results = results.select("table", "region") \
        .withColumn("cells", f.explode(f.col("table.chunks"))) \
        .select([f.col("region.index").alias("table")] + [f.col("cells")[i].getField("chunkText").alias(f"col{i}") for i in
                range(0, 8)]) \
        exploded_results.show(20, True)
Links
- Notebook with full-example
- Table Detection & Extraction in Spark OCR
- More examples can be found in Spark OCR Workshop
- Spark OCR Documentation
- PDF OCR