


A new generation of the NLP Lab is now available: the Generative AI Lab. Check details here https://www.johnsnowlabs.com/nlp-lab/
This is the second part of a blog series explaining how to best use the Analytics charts available in the Annotation Lab to improve the quality of your annotations and thus the quality of your NLP and Visual NLP models. The focus of this blog is on Team Productivity Charts that allow an easy estimation of a team’s performance and productivity over time.
Total Completions
Under this productivity metric, the first two charts show the total number of completions (not to be confused with ground truth submissions) across all project tasks and the completions created in the past 30 days respectively. These two aggregate counts help the team Manager quickly grasp the overall team progress and see how many tasks have been annotated overall and during the last 30 days.
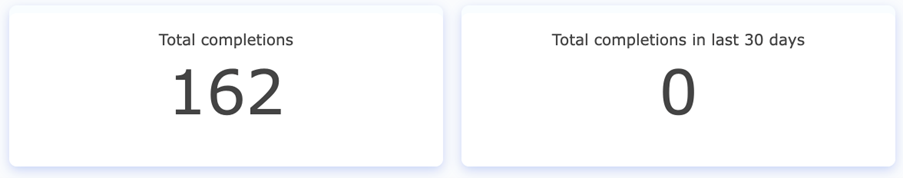
Total completions (v. 3.4.0)
The total Number of Completions per annotator chart highlights the number of completions each annotator has submitted. Usage example: If each annotator was assigned 10 tasks and his number of completions is 40, that means the annotator tool had to (re)work each task four times on average – once to create the first version of annotations and three times to update the subsequent versions. This information is relevant for understanding how efficient the annotators are and how fast they are learning but also how much the annotation guidelines change over time.
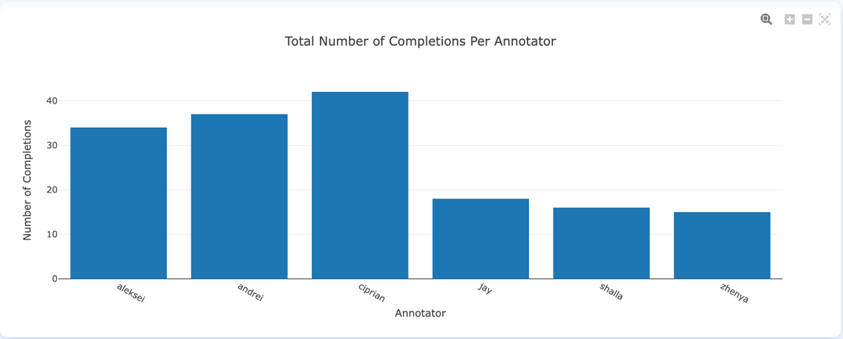
Total Number of Completions per Annotator Chart (v. 3.4.0)
Completions over time
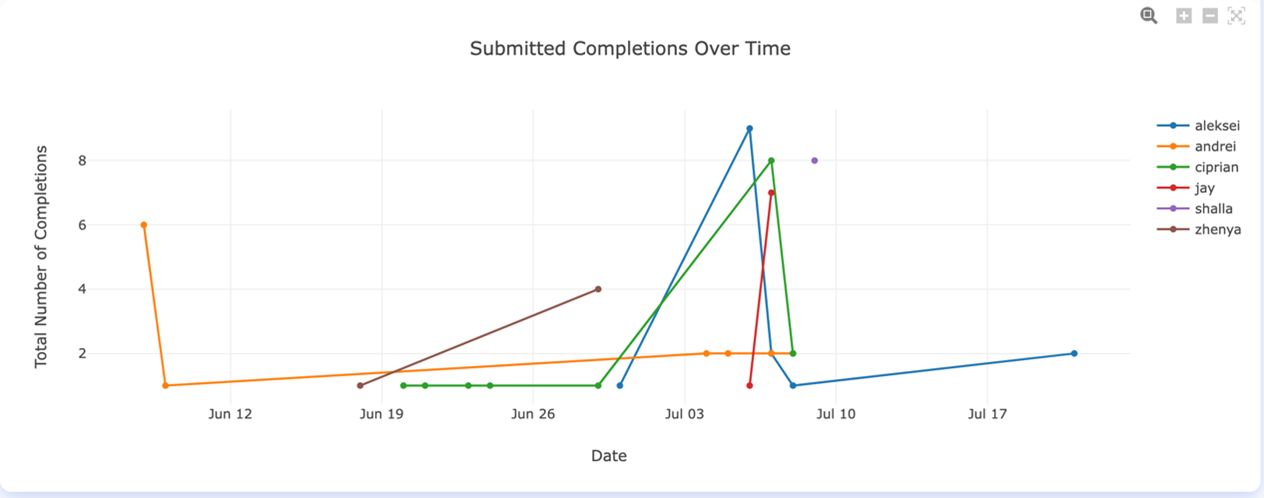
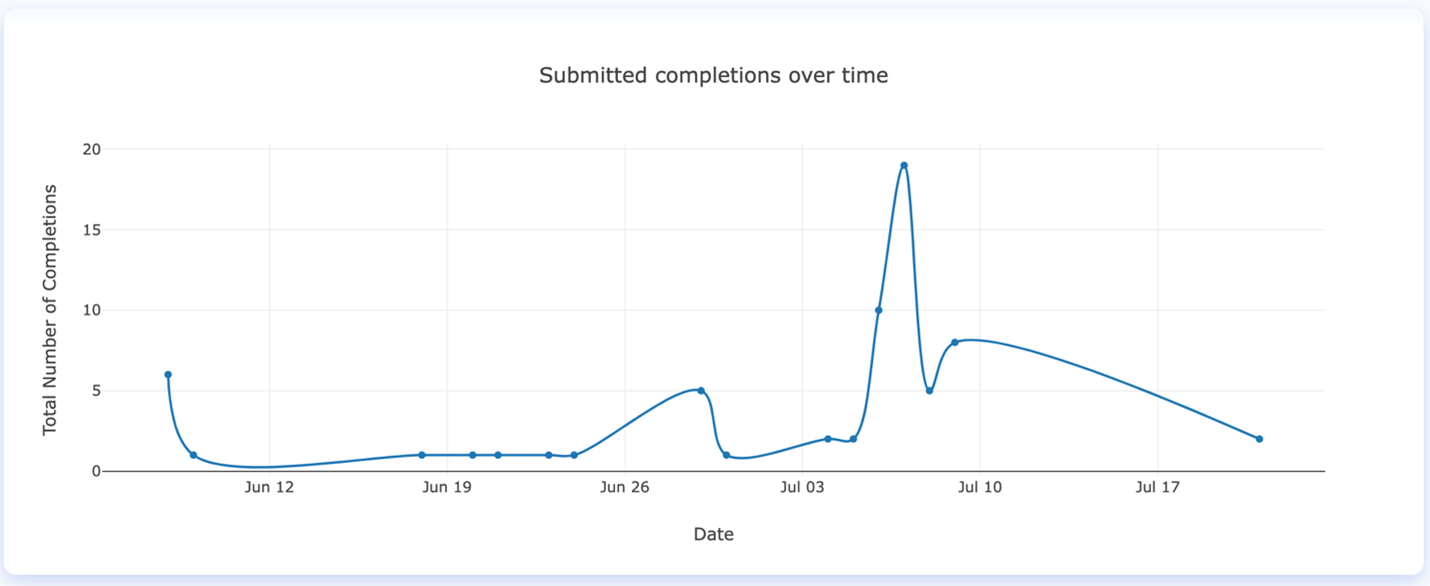
As the majority of annotation projects have tight deadlines, it is crucial to quickly understand how productive your team is. For this, the Submitted Completions Over Time chart, helps the Manager understand the rate of completion creation for each annotator over a period of time. This chart helps identify the days which were more productive for specific users as well as the pace of the team. That is useful information for milestone estimations and planning purposes.
Submitted Completions Over Time Chart (v. 3.4.0)
How much time do the annotators spend on tasks
The average time (in seconds) an annotator requires for creating a completion can be influenced by different factors such as task difficulty, task length, file type, document structure, language, domain expertise, or annotation experience. To evaluate the average time an annotator spends working on a task, you can use the Average Time the Annotators Spent on One Task chart. This indicates the work dynamics between the team members and can be used as a sign of involvement and expertise.
A useful tip for improving annotation speed is to use label shortcuts (hotkeys) and to be careful when defining those so they can be efficiently used. For instance, it is good to assign accessible hotkeys for labels that are used the most, and use keys that are close to each other for entities that tend to be near in the text, such as Test and Test Result.
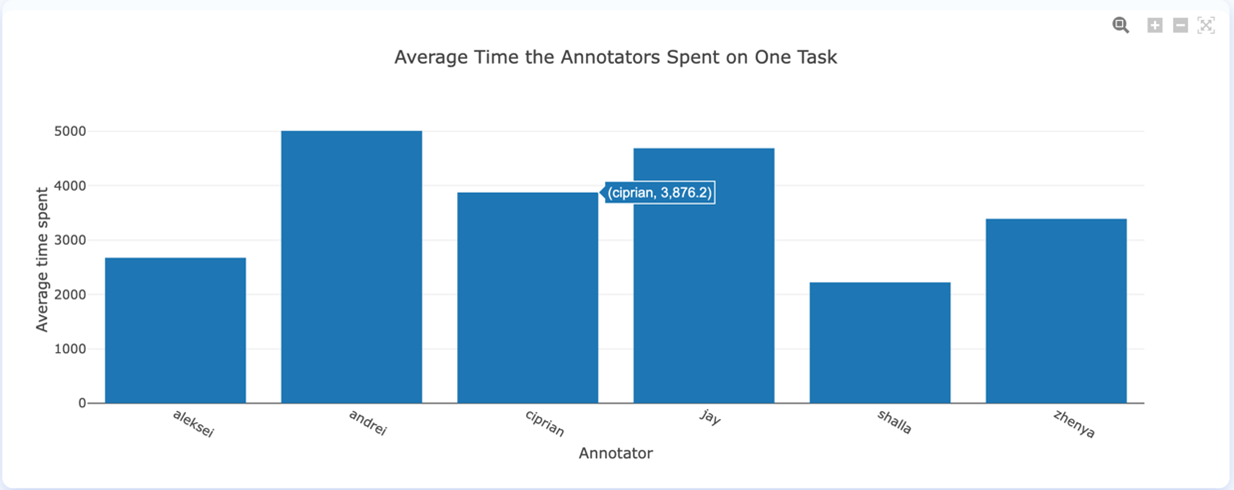
Average Time (seconds) the Annotators Spent on One Task (v. 3.4.0)
The evolution of the number of completions created over a certain time period can be seen in Submitted completions over time chart. This comes in support of the Manager by aggregating completions by days, allowing for proper identification of team/annotators work schedule.
Submitted completions over time chart (v. 3.4.0)
Stay tuned for the last part of this series, where we will analyze in depth the Inter-Annotator Agreement charts that offer many useful features for improving the quality of the annotated data.