


The occurrence of disease can be measured by different indicators. In the last blog, morbidity indicators were covered with a focus on incidence and prevalence. After reading this blog, the reader will be able to understand what do the mortality indicators mean. This can help us to survive with the daily flow of news that discusses different statistical reports about the COVID-19 virus.
Crude Death Rate (CDR)
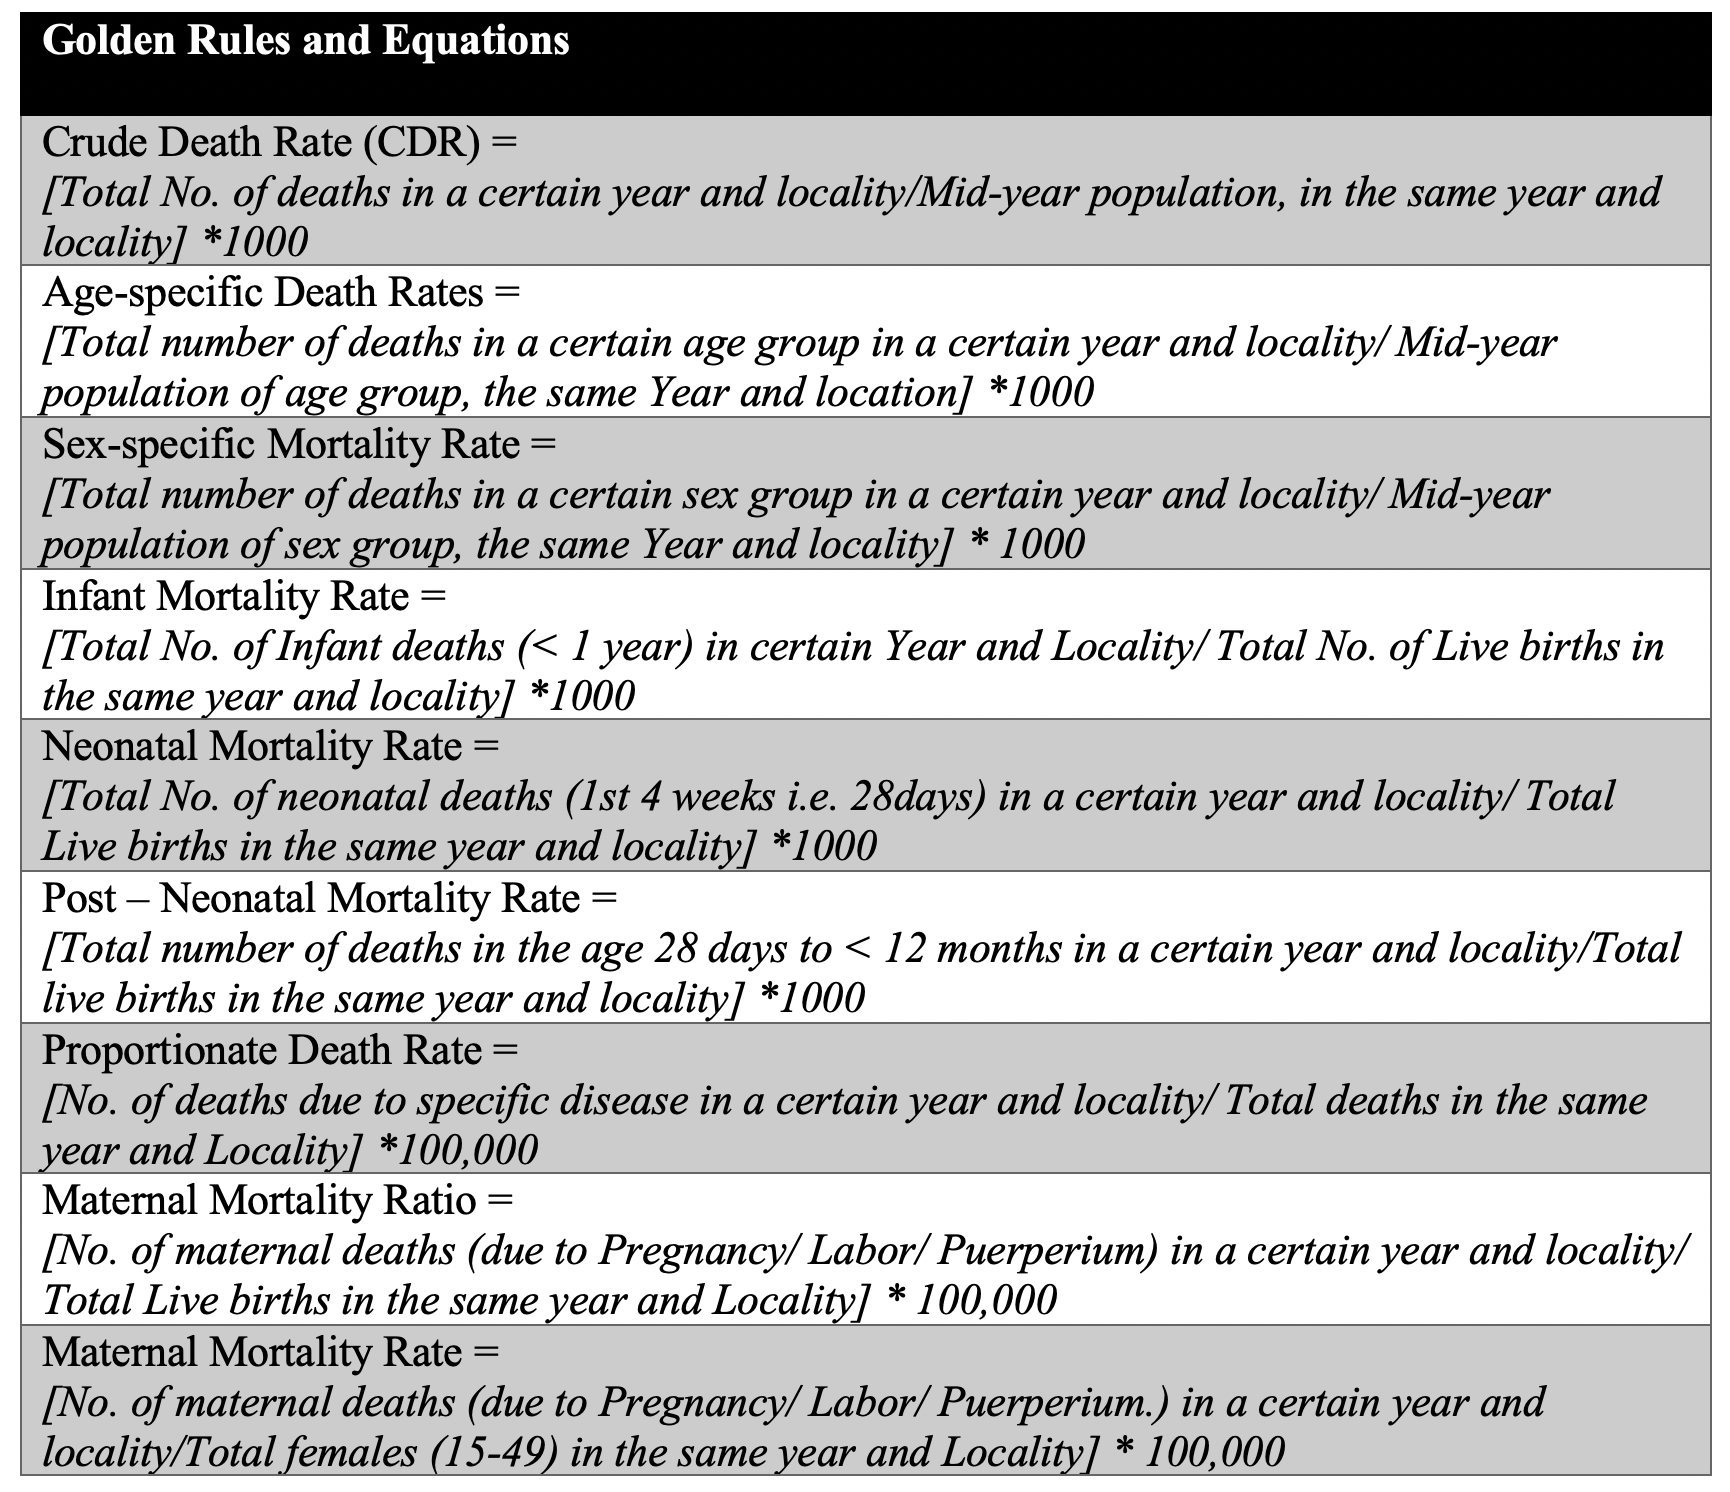
The crude death rate is the total number of deaths in a certain year and locality per 1000 mid-year population in the same year and locality.
Age-specific Death Rates
It is the rate at which deaths occur within a specific age group. In other words, the number of deaths in a certain age group, in a certain year and locality, per 1000 mid-year population of the same age group, in the same year and locality.
1. Infant Mortality Rate.
Infant Mortality Rate is the number of deaths occurring in the first year of life in a certain year and locality per 1000 live births in the same year and locality. It is a good indicator to measure the quality of health services provided.
2. Neonatal Mortality Rate.
Some editors use the words infant, neonate, and post neonate interchangeably which is wrong. The difference between the 3 terms can be explained as follows:
- Infant: First 12 months In Life.
- Neonate: First 4 weeks (28 days).
- Post neonate 28 days to 12 months of life
3. Post-neonatal Mortality Rate.
It is the number of infants’ deaths during the period from 28 days to less than 12 months of life in a certain year and locality per 1000 live births in the same year and locality.
Sex-specific Mortality Rate
It is the rate at which deaths occur within a specific sex group.
Cause-specific Mortality Rate
This refers to the rate at which deaths occur from a specific disease.
It is the number of deaths from a certain disease in a certain year and locality per 100,000 population in the same year and locality.
Proportionate Death Rate
It is the number of deaths from a specific disease (or age) to total deaths in a certain year and locality.
It measures the contribution of the mortality from this specific disease to total deaths.
So, it measures the severity of the disease at the community level. Besides, it helps to identify priority problems, priority groups, to plan specific health interventions.
Maternal Mortality Ratio
It is the no. of deaths of mothers due to causes related to pregnancy, labor, and puerperium among total live births in the same year and locality.
It is an important indicator to measure health care access and quality of health services provided.
Maternal Mortality Rate
Is the no. of deaths of mothers due to causes related to pregnancy, labor, and puerperium in a certain year and locality among 100,000 females in the childbearing period (15 – 49 years) in the same year and locality.
The previous blog introduced some important and unique data repositories to clearly show the significance of the prevalence and incidence in public health studies.
As we are discussing morbidity rates this time, it will be good for the reader to visit one of the most unique catalogs that contain clean and standardized data.
John Snow labs catalog has a complete data package for UK Mortality and Morbidity Data. This data package contains 13 important healthcare datasets. A quick overview of the data package can reveal that included includes data about alcohol-related deaths, breast cancer mortality, infant mortality, neonatal mortality, and under 75 mortalities from various diseases in England. It also provides data on monthly figures on deaths registered in England and Wales.
On the other hand, the catalog contains another important data package for US Mortality and Morbidity Data. This package includes 17 datasets that include data about public health indicators, mortality and morbidity rates for groups of diseases in the United States by state and county from 1980 to 2014.
There are many other interesting datasets that can show the importance of tracking incidence and prevalence. Besides, the reader can download a free sample from the dataset.
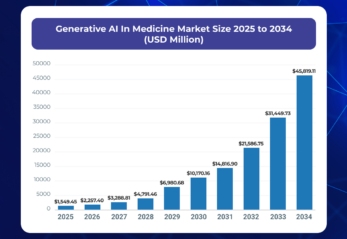
With the growing role of big data in healthcare, Generative AI in Healthcare is paving the way for more accurate disease tracking and predictive models. Additionally, Healthcare Chatbot solutions are transforming patient interaction by providing instant, data-driven responses that help improve health outcomes.