


This is the third blog in a series explaining the vital indices used in measuring the occurrence of diseases. Those indicators are important for any business analyst, solution architect, or subject matter expert (SME) working on the development of a national eHealth or a population health information management system. There are common questions that face eHealth SMEs like “what indicators should be measured?”, “what are the top-priority indicators?”, and “what should the dashboard reveal?”. It is not enough to have only technical knowledge in the business intelligence (BI) field or to be a Kibana expert to be able to do the work efficiently. Analysts and solution architects should be aware of the vital indices to be able to produce good-quality reports and smart dashboards. Hopefully, this vital indices series could be of great help for those working in related fields.
Some of the fertility indicators are recorded and managed by the Ministry of Health offices like the Crude Birth Rate, the General Fertility Rate, and the Fecundity Rate, while other indicators are calculated through community-based surveys like Age-Specific Fertility Rate and the Total Fertility Rate.
The most important fertility indicators can be explained as follows:
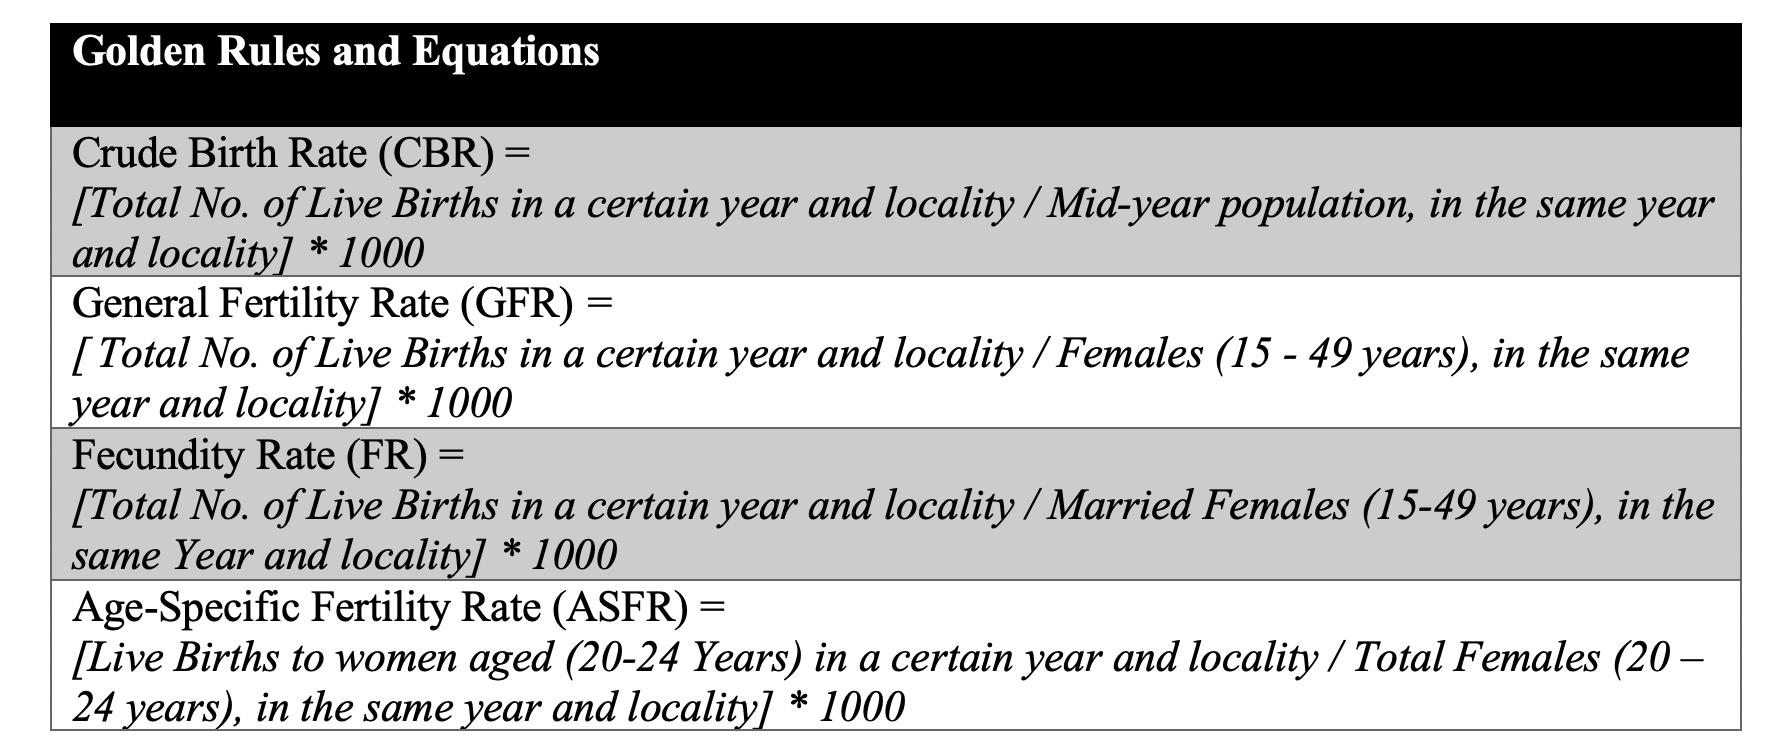
1- Crude Birth Rate (CBR)
It is the number of live births per 1000 population in a certain year and locality.
Although the CBR is an important fertility indicator, still it has its own advantages and limitations.
CBR relates demographic events to the population at mid-year, so it reveals the average population at risk. It is considered one of the vital statistics indicators where a well-established information system provides most “Updated data”.
CBR is a low sensitive indicator for measurement of fertility and not appropriate for comparison between Countries as it relates births to the mid-year population without consideration of population age and sex structure which differs across countries.
2- General Fertility Rate (GFR)
It is the number of live births per 1000 females aged 15-49 years in a specific year and locality.
It is more indicative of fertility, as it relates births to the age-sex group at risk of giving birth.
It is important here to mention that GFR does not consider whether those females are married or not.
3- Fecundity Rate (FR)
It is the number of live births per 1000 Married Women in the Reproductive Age (MWRA) in a specific year and locality.
It is a more sensitive fertility indicator.

4- Age-Specific Fertility Rate (ASFR)
It is the number of live births to women in a specific age interval (usually 5 years), per 1000 females in the same age interval, in a certain year and locality.
It is the more sensitive indicator of the fertility of females in the different age groups. It considers all females and identifies “at-risk pregnancies” and those in need of family planning (F.P). Besides, it is used to calculate the Total Fertility Rate.
5-Total Fertility Rate (TFR)
TFR is concerned with determining how many children would women in this population have, on average, when they complete their childbearing period if they continue to have children at the rate they did in this year.
In other words, it is the average number of children that would be born alive to a woman during her reproductive life, if she passes through all her childbearing years, compliant to age-specific fertility rates of a specific year.
It is used for comparison between countries because it is standardized for age and the age structure of the individual countries.
6- Children Ever Born (CEB)
Children ever born (CEB) to women in a specific age group is the average number of children born alive to women in that age group.
It is a measure of a woman’s lifetime fertility at the time the data is collected.
It is also known as Summary Birth Histories (SBH).
7- Cohort Fertility (CF)
It is the analyses used to compare a cohort (a group of women born in the same year) from the current generations of women of childbearing age with the fertility levels of previous generations.
It can measure the proportions of women having one, two, or more numbers of children.

Simply, it is the fertility (the number of live births) produced by a specific group of women throughout their reproductive life.
8- Parity Progression Ratios (PPR)
Simply, it is the fertility (the number of live births) produced by a specific group of women throughout their reproductive life.
PPR can be defined as the proportion of women of a given parity (number of children a woman already has) who have already had a certain number of children and decided to have more children. It is an interesting and useful measure of fertility.
PPRs are critically important to be able to understand the distribution of cohort fertility (the proportion of women in a cohort who end up with exactly no children, exactly one, exactly two, …etc. at the end of the childbearing years).
The most widely used measures of fertility are the ASFR and TFR. Although ASFR and TFR are extremely useful, they still have some limitations. They do not consider real changes in fertility in a short-time interval. Moreover, they are affected by the timing of births (tempo effects). On the other side, PPRs are insensitive to tempo effects.
Datasets concerned with population, health (especially fertility indicators) could be particularly important. Analyzing fertility surveys can yield important facts that could affect any government plans.
The Demographic and Health Surveys (DHS) Program repository contains a huge amount of important data as the program collected and analyzed data populated from more than 400 surveys in more than 90 countries, related to population, health, and nutrition. The DHS Program website contains many important datasets and model datasets available for download, but you must be aware of the data coherence and integrity as many of the national surveys that took place in developing countries are prone to have incomplete or missing data.
Some specialized companies like John Snow Labs (JSL) can save your time by offering curated and well-reviewed datasets. The datasets are reviewed both manually and electronically through a team of experts.
JSL catalog contains interesting datasets that could reveal to the reader the importance of fertility indicators. The catalog has 2 datasets for “European Census Population Fertility Life Expectancy”. The first one contains data categorized by region, while the data in the second is categorized by country. Both datasets cover data on population, fertility, as well as life expectancy in recent years or projected to 2050.
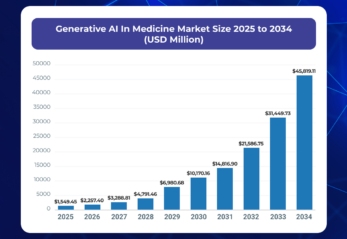
Leveraging these fertility indicators, the application of Generative AI in Healthcare provides a deeper understanding of population health trends, while the use of Healthcare Chatbot technology offers personalized insights and recommendations, helping individuals make informed decisions about reproductive health and family planning.