Demos
































Every de-identification program reaches the same moment. A new batch arrives — a million notes from a new hospital, a new note type, a year of fresh records. Someone asks: which of these can we release, and how sure are we?
Most teams answer with a number from validation day. The pipeline scored 99% on the golden set, so the new data must be fine. That number was true once, for that data. It says very little about documents the pipeline has never seen.
The honest answer has three parts. Watch how the data changes. Screen every output document for PHI that got through. Then prove, with a small random audit and a bit of statistics, how much PHI is left in what you share. This post explains what to measure at each step, why it never stops, and how it scales to millions of records on a small review budget.
Why validation day is not enough
De-identification quality is not a property of the model alone. It is a property of the model on a given set of data. Change the data, and the quality changes with it, often silently.
In production, the data never stops changing:
| What changes | Example | What can quietly break |
|---|---|---|
| A new source or site | A new hospital, insurer or EHR export | Unfamiliar ID formats, templates and headers |
| A new document type | Telehealth transcripts, scanned notes, forms, chat logs, voice | Identifiers split across lines; field labels mistaken for PHI |
| A new specialty | Oncology notes instead of primary care | Different vocabulary, different identifiers |
| A pipeline upgrade | A new rule, model version or processing step | A fix in one place breaks masking in another |
| A monitoring upgrade | A new version of the model that checks the output | The numbers move because the ruler changed, not the data |
A golden set is a photograph. Production is a film. The question is not whether your data will drift. It is whether you will notice when it does, and whether you can show what it did to the PHI in your release.
What we found when we tested on unseen data
Over the past months, we stress-tested our own de-identification pipelines and PHI decision models on data they had never seen. That included notes written after the models were trained. Several comfortable assumptions did not survive.
| What teams usually assume | What we measured | What it means |
|---|---|---|
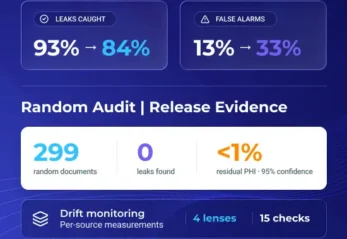
| A good benchmark score carries over | On new notes, the share of leaks caught fell from 93% to 84%. False alarms rose from 13% to 33%. Leaks reaching the release roughly tripled. | A test score is a planning number, not evidence about your release |
| Planted test leaks are realistic | Leaks we planted by hand were caught 97% of the time. The pipeline’s own real misses: 84%. | Test on real pipeline misses, not invented ones |
| Misses are spread evenly | Every ZIP code and card number was caught. A third of usernames were not. Ages over 90 slipped too. | Misses cluster by identifier type, so averages hide them |
| An overlapping mask is a mask | “SSN: ZZ 78 90 71 ***” counted as masked under overlap scoring | Partly masked identifiers are leaks and must be scored as leaks |
| Two models agreeing is safer | Requiring two models to agree raised precision, but nearly doubled the leaks in the release | Agreement rules trade safety for fewer flags. That is the wrong direction for a release |
| Any capable model can judge “is PHI left?” | A general judge model asked that question caught 5% of real leaks. Purpose-built document classifiers caught 79% to 86%. | Leak detection needs models trained for exactly that task |
| Skipping PHI-free documents is harmless | One fast setting called 8 of 320 PHI notes “PHI-free”. A stricter setting called none. | Any document that skips de-identification is a release path. Validate it like one |
None of this means de-identification does not work. It means you cannot assume it keeps working. You have to keep measuring.
Three numbers you should never mix up
“Is it safe to release?” is really three questions. Each has its own number and needs its own evidence.
| Number | The question | The evidence |
|---|---|---|
| Release share | What share of documents does the screening model let through? | Run the model on every document. Cheap and fast. |
| Leak rate in the release | Of the documents we release, what share still contain any PHI? | A random human audit of the release, with a statistical bound |
| Expert Determination | Is the re-identification risk very small, for this data and this recipient? | An expert’s judgment of identifiers, quasi-identifiers and context |
The first number is easy and tempting. It is not a safety claim. The second number is the one people mean when they ask “is it anonymized?”. The third is the legal standard under HIPAA’s Expert Determination method, and it stays with the expert. A leaked age is not the same risk as a leaked name.
One more decision comes first: what counts as a leak? Any residual PHI, or only direct identifiers? Under HIPAA Safe Harbor, a state name or an age under 90 is not an identifier. Write the definition down before anyone counts anything.
What a reliable drift framework measures
A reliable drift signal for PHI work looks through four lenses, not one. Each catches a different failure. Each needs different inputs, so the first one works before the pipeline even runs.
| Lens | The question it answers | Why it matters |
|---|---|---|
| The documents | Do new documents look like the ones we validated? Length, type mix, vocabulary, PHI-like patterns. | Flags new sources and formats before any model runs |
| What the pipeline finds | Is it finding the same kinds and amounts of PHI? | A sudden drop in names found can mean names are being missed |
| How sure the pipeline is | Is its confidence falling for some identifier types? | Confidence often drops before accuracy visibly does. It is an early warning that needs no labels. |
| What a PHI decision model sees | How much PHI comes in? How often does masked output still look like it holds PHI? | The only lens that looks at the output, which is where leaks actually are |
A drift number only helps if you can trust it. Seven rules separate a real signal from noise:
- Calibrated to your data. Every corpus wobbles a little by chance. Measure that normal wobble first, and alert only above it. A monitor that fires on healthy data gets muted, and a muted monitor is worse than none.
- Beyond sampling noise. A flag rate that moves from 4% to 5% on 60 documents may mean nothing. On 6,000 documents it may mean a lot.
- The worst signal wins. One alarming signal is not cancelled by nine quiet ones.
- Missing is not passing. A signal that could not be computed is reported as unknown, never as fine.
- A pinned measuring stick. Record the exact version and threshold of the model that checks the output. When you upgrade it, re-baseline. Otherwise the upgrade looks like drift.
- One baseline per source. Each site, note type or domain gets its own normal. A new source stays unvalidated until it has its own evidence. It never borrows a good rate from another source.
- A quiet output check never cancels input drift. On truly new content, the checker may share the pipeline’s blind spots.
How the drift score is calculated
Every new batch is compared with a frozen reference: the data the pipeline was validated on. The comparison runs 15 measurements across the four lenses. Each one answers a narrow question, uses a measure suited to its kind of data, and has two alert levels, watch and drift.
Four kinds of measurement
| Measure | The question it answers | Used for |
|---|---|---|
| Population stability index | Did the shape of a histogram move, bucket by bucket? | Document length |
| Jensen–Shannon distance | How different are two mixes? 0 means identical, 1 means nothing in common. | Note-type mix, vocabulary, entity mix, model score shapes |
| Relative change | How far did a rate or average move, compared with its old value? | PHI per document, entity rate, flag rates |
| Largest drop | Did any single entity type lose confidence? | Model confidence |
The first two ask whether a shape changed. Relative change asks whether a level changed. Largest drop asks whether any one part weakened, even if the average looks fine. Rates from the PHI decision model get one more test: a change only counts if it is beyond sampling noise (a two-proportion test at the 1% level).
| Lens | Component | What it measures | Why it matters | Watch / drift at |
|---|---|---|---|---|
| The documents | Document length | Stability index over the length histogram | Longer notes give more chances to miss one identifier. A new format often shows up as a new length profile first. | 0.10 / 0.25 |
| The documents | Note-type mix | Distance between the mixes of note types | Each note type has its own PHI patterns and templates | 0.10 / 0.20 |
| The documents | Vocabulary shift | Distance between the mixes of the most common words | New specialties and templates put identifiers in unfamiliar context | 0.10 / 0.20 |
| The documents | New-word rate | Share of today’s common words never seen in the reference | Unseen words mean unseen context, where models fail most | 15% / 30% |
| The documents | PHI-like patterns | Change in date, phone, email and name-shaped strings per document | A model-free check. It sees more identifier-like content even when the model misses it. | 15% / 30% |
| What the pipeline finds | Entity mix | Distance between the mixes of entity types found | A drop in one type, such as names, can mean that type is being missed | 0.10 / 0.20 |
| What the pipeline finds | Entity rate | Change in entities found per 1,000 words | Separates “more text” from “more PHI found” | 15% / 30% |
| What the pipeline finds | PHI per document | Change in entities found per document | The simplest sign that detection has changed | 15% / 30% |
| How sure the pipeline is | Confidence drop | Largest fall in average confidence for any entity type | An early warning that needs no labels. Confidence usually falls before accuracy does. | 0.05 / 0.10 |
| How sure the pipeline is | Low-confidence rate | Change in the share of entities found with under 50% confidence | More borderline calls means more misses are close | 25% / 50% |
| What PHI Guard sees | PHI coming in | Change in the share of raw documents that hold PHI | Tells you whether the input itself got harder | 15% / 30% |
| What PHI Guard sees | Raw score shape | Distance between raw score histograms | Catches a shift before it crosses the threshold | 0.10 / 0.20 |
| What PHI Guard sees | Masked flag rate | Change in the share of masked documents flagged | The closest drift signal to an actual leak | 15% / 30% |
| What PHI Guard sees | Masked score shape | Distance between masked score histograms | Shows documents creeping toward the threshold | 0.10 / 0.20 |
| What PHI Guard sees | Flag rate per source | Largest significant change in flag rate for any one source | Shows where a change lives. A new source that is 5% or more of the batch is at least watch. | 15% / 30% |
The alert levels above are defaults. Calibration, below, raises them to fit each corpus.
From 15 numbers to one verdict
- Each component gets a band, stable, watch or drift, from its two alert levels.
- Each component is also placed on a common 0–100 scale. 50 means it reached its watch level and 100 its drift level. That makes a length change and a confidence drop comparable.
- Each lens takes its worst component. The overall verdict takes the worst lens. Nothing is averaged away.
- A component that cannot be computed is listed as unavailable, with the reason. The report says how many of the 15 were measured.
- A batch with fewer than 30 documents still gets a report, but it is marked low-confidence.
Calibration: alert levels that fit your data
Two samples of the same data never match exactly. With few documents and many categories, a mix distance looks large purely by chance. In one 100-note test corpus, a slice of the reference data itself crossed the default drift level for note-type mix and vocabulary. Nothing had changed.
So before trusting any alert, the reference is split against itself 40 times. For each component, the value that healthy data reaches 95% of the time becomes its noise floor. The watch level is set at that floor, and the drift level at twice it. Levels are only ever raised above the defaults, never lowered.
Guardrails for the PHI Guard lens
- Pinned version. The reference records the PHI Guard model’s version and threshold. If they differ, these components report “re-baseline” instead of drift.
- Raw and masked read together. The pair explains why a number moved, as the next section shows.
- Enough data per source. A source needs at least 30 documents on both sides before its flag rate is compared.
How PHI Guard decision models help
PHI Guard models answer document-level questions, fast enough to ask them of every document. Three questions matter for a release:
- Raw: does this document contain PHI at all, and how much PHI is coming in?
- Masked: after de-identification, does this document still look like it holds PHI?
- Richness: how much PHI does this document hold? In our tests, the richest 20% of notes by this score held 46% of all PHI. A perfect ranking would hold 49%.
Read the raw and masked signals together, and a moving number explains itself:
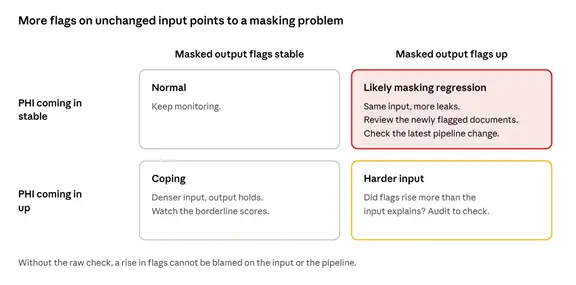
Reading raw and masked PHI Guard signals together · 4 states
In practice, the models give you four things:
- A release set: everything the masked model does not flag, at a frozen threshold.
- A ranked review pile: flagged documents, ordered so reviewers see the riskiest first.
- Smarter audit samples: oversample PHI-rich documents, with known weights, so the bound stays valid.
- Drift signals on the output: the flag rate per source, against that source’s own baseline.
One caution. The decision model picks the release set. It does not certify it. On truly new data, it can share blind spots with the pipeline. The random audit is what turns its choice into a claim.
What zero leaks proves: 5% versus 1%
Here is the good news. You do not need to review a million documents to make a strong claim about a million documents. A small random sample, reviewed in full, is enough, as long as it is truly random and drawn from what you will release.
The statistics come from the binomial distribution. If 1% of a release leaked, a random sample of 300 would almost always catch at least one leak. So when 300 random documents come back clean, you can say with 95% confidence that fewer than 1% of the release contains PHI.
| Claim, with 95% confidence | Random documents reviewed, zero leaks found | What the claim still allows, per million released |
|---|---|---|
| Fewer than 5% leak | 59 | up to 50,000 documents with some PHI |
| Fewer than 2% leak | 149 | up to 20,000 |
| Fewer than 1% leak | 299 | up to 10,000 |
| Fewer than 0.5% leak | 598 | up to 5,000 |
| Fewer than 0.1% leak | 2,995 | up to 1,000 |
Two things stand out:
- The sample size depends on the claim, not on the dataset. 300 clean documents support “under 1%” for ten thousand records or for a hundred million.
- 5% is not small at scale. It allows up to 50,000 documents with some PHI in every million. And if your masked output already leaks in fewer than 5% of documents, releasing everything meets a 5% budget with no screening at all. A 5% budget can be a first step for internal, contract-bound use. Wider sharing usually needs 1% or lower.
Where teams go wrong
- “Under 1%” is a share, not a chance. It does not mean a 1% chance that anything leaked. In a large release, some documents with PHI are close to certain. The claim limits how many.
- Audit what you share. Sample the release after screening, not the whole raw dataset.
- Count every round. Ten rounds of 300 clean documents is one sample of 3,000, which supports “under 0.1%”. Redrawing until one round comes back clean proves nothing.
- Zero is not guaranteed, even for a good release. A release whose true leak rate is a healthy 0.13% still fails a zero-in-300 test about one time in three. Allowing at most one leak in 500 documents also proves “under 1%”, and it rejects good releases far less often. Set the rule before you start.
- Sample patients, not just notes. Notes from one patient share the same name and dates. They are not independent evidence.
- Reviewers miss things too. Have a second reviewer recheck part of the sample, and don’t show reviewers the model’s score.
Thresholds: the dial between sharing more and leaking less
A PHI decision model gives every document a score. The threshold decides which scores mean “may still hold PHI”. Lower it, and the model catches more leaks, but it also holds back more clean documents. That trade is the central business decision of any release.
Two facts make it easier to reason about:
Catching leaks sets how much leaks. At the same catch rate, every model lets the same number of leaking documents through per million.
Avoiding false alarms sets how much you share. A model with fewer false alarms does not leak less. It lets you release more clean documents.
So “better safe than sorry” needs care. Holding back clean documents does not make a release safer on its own. Only catching more leaks does. False alarms are the price of a stricter threshold, and a better model lowers that price.
| Setting | Leaks caught | Documents released | Released documents still leaking | Leaking documents per million |
|---|---|---|---|---|
| Default threshold | 93% | 83% | 0.41% | about 3,400 |
| Tuned to catch 95% | 95% | 78% | 0.32% | about 2,500 |
| Tuned to catch 98% | 98% | 59% | 0.17% | about 1,000 |
| Newer model, tuned to catch 98% | 98% | 76% | 0.13% | about 1,000 |
Projections from our test data, assuming 5% of masked documents still hold some PHI. The newer model catches the same share of leaks at the strictest setting and releases 17 points more of the data.
Three cautions keep the dial honest:
- These are planning numbers. On unseen notes, the same model caught fewer leaks. Choose the threshold on labeled data, freeze it as a number, and let the audit confirm it on your data.
- Never tune and prove on the same documents. A threshold picked to make an audit pass has proven nothing.
- One threshold does not mean one risk. On a new source, a strict threshold can mostly remove clean documents. When sources differ, set and verify the threshold per source.
Millions of records, a small review budget
Review effort depends on the claim and the number of buckets, not on the number of documents. Screening every document is cheap. Human review is expensive. So let the model screen everything, and spend human time only where it creates evidence.
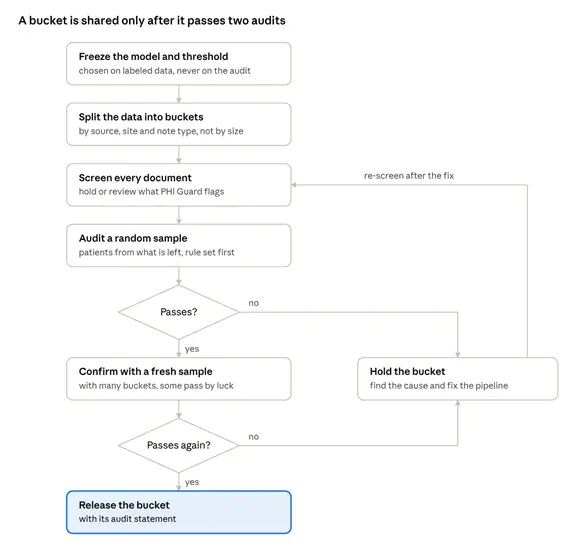
Bucketed release flow · 5 steps, 2 checks
Buckets are the key. Group documents that share a risk profile: the same site, source and note type. Each bucket gets its own verdict, so one bad source cannot hide inside a good average.
A worked example. One million documents arrive from five sites, in two note types. That makes ten buckets.
- PHI Guard screens all one million documents in hours.
- Flagged documents are held. They are reviewed if they matter, and withheld if they don’t.
- From each bucket’s release, 500 random documents are reviewed. A bucket passes with at most one leak.
- That is 5,000 reviewed documents, half a percent of the data, to support “under 1%” for every bucket that passes.
Set the audit rule before you start, and make it fair to good buckets. Zero leaks in 300 documents and at most one leak in 500 both prove “under 1%”. The second rejects far fewer good buckets:
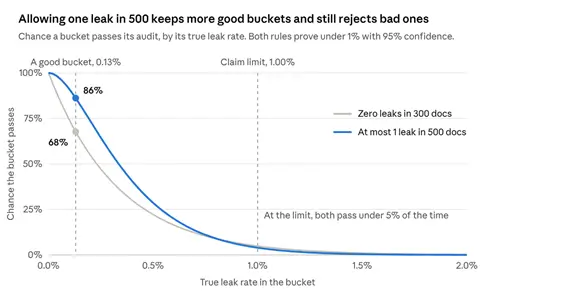
Computed from the binomial distribution · two audit rules, true leak rates 0–2%
If even 5,000 reviews is too many, there are honest ways to spend less:
- Merge buckets that behave alike. Fewer buckets means fewer audits. Never merge a new source into an old one to borrow its record.
- Start with a looser claim. 59 clean documents support “under 5%” for internal, contract-bound use while the stricter audit runs.
- Release less, with a stronger claim. Holding back 30% of the data with a defensible bound beats releasing 95% with none.
Each passing bucket ships with one plain sentence: “We reviewed N randomly chosen documents from this release and found K with residual PHI. With 95% confidence, fewer than X% of its documents contain residual PHI.” It holds for that bucket, that model version and that threshold.
Why this is never finished
A release claim covers one batch, one pipeline version and one model version. Change any of them, and the claim has to be earned again. That makes PHI assurance an operating process, not a project with an end date.
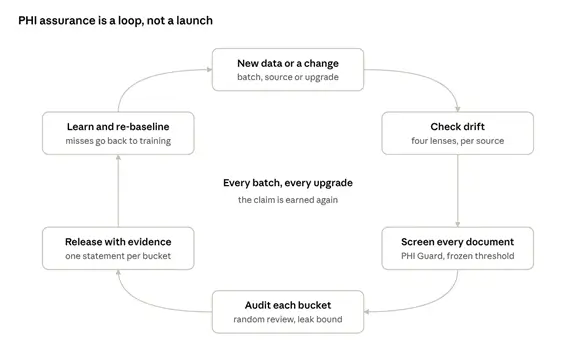
The ongoing PHI assurance loop · 6 stages
Every turn of the loop makes the next one better. The misses an audit finds become training examples and new rules. The pipeline improves, fewer documents are held, and each audit passes more often.
Not every change needs the same response. Sort each one into a lane, so routine work moves fast and the evidence is still on record:
| Lane | When it applies | What happens |
|---|---|---|
| Proceed | Same validated scope. Drift stable. No drop on the golden set. No unexplained change in screening results. | Release, and record the evidence. |
| Targeted check | A new rule. A bounded change in the data. An unexplained change in screening results. | Compare old and new output on the same inputs, review what changed, then release. |
| Expert review | Drift outside the validated population. A confirmed rise in leaks. A new data type. A change in who receives the data. | The expert reviews before anything is released under the existing determination. |
A drift alert is a reason to look. On its own, it does not cancel an existing determination. But a release made after an alert, without looking, has no evidence behind it.
How John Snow Labs automates it
All of this is too much to run by hand, every week, for every source. At John Snow Labs, we build it into the de-identification workflow itself, so the evidence is produced as you run the pipeline.
- Drift checks on every batch. Each new batch is compared with its validated reference through all four lenses. Thresholds are calibrated to that corpus’s own noise. Each source gets a clear stable, watch or drift verdict, with the reason.
- PHI Guard decision models on every document. Purpose-built models for raw text, masked output and PHI richness. They are fast enough to screen every document, not just a sample: roughly 100 times faster per note than a large general judge model.
- Release planning. Give it a target leak rate and a review budget. It recommends a threshold, the number of documents to audit per bucket, and the chance each audit will pass.
- Audit-ready bounds. Audit results become a leak-rate bound for each source and for the whole release. Sources without an audit are clearly marked as unvalidated.
- Regression checks on every upgrade. Old and new pipeline versions run on the same inputs. Documents whose verdict changed are surfaced before anything is released.
- Evidence for the expert. Drift findings, screening results and audit bounds flow into the Expert Determination report as supporting evidence. The system produces the evidence. The expert makes the determination.
- Inside your environment. It all runs where your data lives. Drift profiles keep statistics, not text.
Questions to ask about your own workflow
If any of these is hard to answer, your release process is resting on a snapshot, not on evidence:
- What share of the documents you released last quarter still held PHI, and how sure are you of that number?
- Would you notice if a pipeline upgrade broke masking for one note type?
- Did your last “drift” alert come from the data, or from a new version of the tool that measures it?
- Does every new source get its own validation, or does it borrow the score of the old ones?
- Is your review effort sized to the claim you make, or to whatever time was left?
- If a regulator or partner asked tomorrow, could you show the evidence behind “de-identified”?
The good news is that every one of these has an answer. Drift can be measured reliably. Leaks can be screened at production speed. And a few thousand well-chosen reviews can support a defensible claim about millions of records. That is the work we do with our customers every day.
To see how this would look on your data, talk to our team.